This page provides a detailed account of the methodology behind InfluenceMap's LobbyMap platform. It provides an explanation of the platform's scope, key characteristics, and core metrics and outputs, as well as detailed review of the LobbyMap platform system for benchmarking and scoring corporate climate policy engagement. Users that would like to explore some of the specific benchmarks used by the LobbyMap platform can do so here.
Successive reports from the UN's Intergovernmental Panel on Climate Change (IPCC) have outlined the urgent need to act on climate change and the role of governments in driving this process forward. However, worldwide efforts to introduce meaningful policy designed to accelerate this transition are lagging.
Political opposition from powerful parts of the economy that are threatened by a transition in line with the IPCC’s recommendations, particularly sectors integrated into the fossil fuel value chain, is widely understood to be a fundamental hurdle to urgently needed policy action.
Prior to the launch of InfluenceMap’s LobbyMap platform, there was no meaningful way to measure corporate engagement with climate policy. The LobbyMap platform represents the world’s first, and leading, platform to track and score companies and their industry associations on their climate policy engagement and influence, thus mapping out the corporate climate policy landscape.
This document summarizes InfluenceMap's LobbyMap methodology for assessing companies and industry associations on their climate policy engagement for the benefit of our users and stakeholders.
The methodology adheres to key features of sound corporate assessment metrics: objectivity, transparency, ease of comprehension and use, and allowing for like-for-like comparisons across and within sectors. The system is designed to generate results that are identical and replicable regardless of who engages in the scoring process.
InfluenceMap defines “policy engagement” using the UN Guide for Responsible Corporate Engagement in Climate Policy (2013), which defines a range of corporate activities as engagement, such as advertising, social media, public relations, and direct contact with regulators and elected officials.
Using this definition, the LobbyMap process collects evidence from a range of publicly accessible data sources to build a reliable representation of corporate policy engagement. These include organizational websites, senior management statements, regulatory consultation comments, financial disclosures, and reports from reliable media outlets.
The methodology is designed to be “policy neutral,” and InfluenceMap does not take internal positions on the best climate policy. Instead, the scoring system measures corporate positions against external, authoritative benchmarks. These are derived from IPCC science (science-based policy benchmarks), as well as statements and proposals from government mandated bodies tasked with delivering on the Paris Agreement’s goals.
As of September 2024, the LobbyMap platform covers approximately 600 companies and 300 leading industry groups. The process for selecting companies prioritizes the largest companies as determined by the Forbes Global 2000, as well as factors such as sector and regional headquarters. A key area of future growth for the LobbyMap platform relates to companies headquartered in low and middle income countries that will be critical for addressing the climate crises, including China, Brazil, India, Indonesia, Mexico, and South Africa.
The UN's climate science body, the Intergovernmental Panel on Climate Change (IPCC), has often emphasized the necessity of robust and enforceable global government policies to enable private sector action on climate change. The IPCC's 2022 AR6 Working Group III report clearly explained the central importance of coordinated planning and decision-making across various levels of governance, spanning the local and sub-national to national and global levels, to attain the objectives of the Paris Agreement. The report underscored that urgently needed transformations “will hinge on conscious policy to change the direction in which energy, land use, agriculture and other key sectors develop.”
Approaching a decade since the 2015 Paris Agreement and more than a quarter century since the United Nations Framework Convention on Climate Change (UNFCCC) Kyoto Agreement of 1997, there is still a glaring inadequacy in government efforts to curb the alarming progression of global warming. This shortfall is evident in the comprehensive global assessment conducted by Climate Action Tracker, which highlights the disparity between government actions and necessary measures to restrict warming to 1.5°C. The UNFCCC’s 2023 “Global Stocktake,” the purpose of which was to assess collective progress towards the goals of the Paris Agreement, concluded the same, emphasizing that there is now a “rapidly narrowing window” to raise ambition.
The IPCC has pinpointed "opposition from vested interests in the status quo" and the "influence of entrenched fossil fuel interests" over the policymaking process as significant obstacles to progress in achieving the objectives outlined in the Paris Agreement. This concern has also garnered attention from prominent international bodies, such as the OECD, which highlighted these obstacles in its 2021 report titled "Lobbying in the 21st Century." Additionally, political leaders, including Barack Obama, Christiana Figueres (the former Executive Secretary of the UNFCCC responsible for delivering the Paris Agreement), and António Guterres (the current UN Secretary General), have echoed this concern.
Prior to 2015, when InfluenceMap was established, various studies identified the significance of corporate policy engagement on climate change. These include:
A 2011 paper from Harvard Business School arguing that a broad measure of corporate impact on the climate change agenda should consider the company’s impact on climate policy;1
Studies conducted by The Union of Concerned Scientists in 2012 and 2014, which highlighted the role of US corporates2 and their industry groups3 in blocking US climate policy; and
A 2015 study by the University of Westminster4 that found that a core group of EU industry groups held key roles in preventing the progression of climate policy in Europe.
The academic literature has since explored this issue in increasing detail, scrutinizing different strategies and tactics companies use to influence the climate change public policy agenda,5 as well as studying the impact of specific industry or corporate lobbying campaigns on policy outcomes.6
To expand on this exploration of corporate influence on climate change public policy, InfluenceMap developed the LobbyMap platform—the world’s only systematic approach to tracking and assessing companies and industry groups on their climate policy engagement. The purpose of this work is to produce a detailed analysis of corporate climate policy engagement at the company level. The platform covers over 600 of the world’s largest companies and provides a unique insight into the broader corporate climate policy engagement landscape.
This platform is widely used by a range of stakeholders that wish to better understand this critical issue for addressing climate change, including:
| Stakeholder Type | Description | Example |
|---|---|---|
| Investor | InfluenceMap's data is integrated into the procedures of numerous mainstream investors who are increasingly considering climate policy engagement as a fundamental and forward-looking metric when assessing a company's preparedness for the energy transition. | Each year, InfluenceMap has over 1000 meetings and other significant interactions with over 250 different investor groups regarding its corporate sector analysis. InfluenceMap functions as a data provider for various investor initiatives, and it serves as a member of the Technical Advisory Group for Climate Action 100+, an investor-led initiative that comprises over 600 investors globally. |
| Corporate | Policy engagement is widely recognized as a mainstream climate concern for the corporate sector. Companies are utilizing the LobbyMap platform to gain deeper insights into their own performance, assess how they compare to their peers, and evaluate the performance of their industry associations. The platform particularly serves as a valuable tool for corporate policy leaders, enabling them to review and manage their connections with industry associations and more effectively focus their policy interventions in alignment with their climate goals. | Each year, InfluenceMap has over 500 direct engagements with over 200 major companies and industry associations on our scoring assessments and analysis. |
| Media | Global media outlets also rely on InfluenceMap as a reputable, independent, and objective data provider, offering unique insights into subjects that are intricate and contentious. InfluenceMap's credibility and impartiality make it a valuable resource for journalists and news organizations seeking reliable information on complex issues. | Each year, InfluenceMap's research is cited in over 3000 media articles, including over 500 significant pieces in major media outlets. |
| Civil Society | A diverse group of NGOs and campaign groups extensively utilizes InfluenceMap's publicly available and freely accessible analysis to bolster a wide array of initiatives aimed at urging companies and governments to adopt more ambitious measures in addressing the climate crisis. InfluenceMap's accessible data plays a pivotal role in supporting their advocacy efforts and strengthening their calls for action. | Each year, InfluenceMap engages with over 250 different NGOs and campaign groups around the world that are actively utilizing the LobbyMap database. |
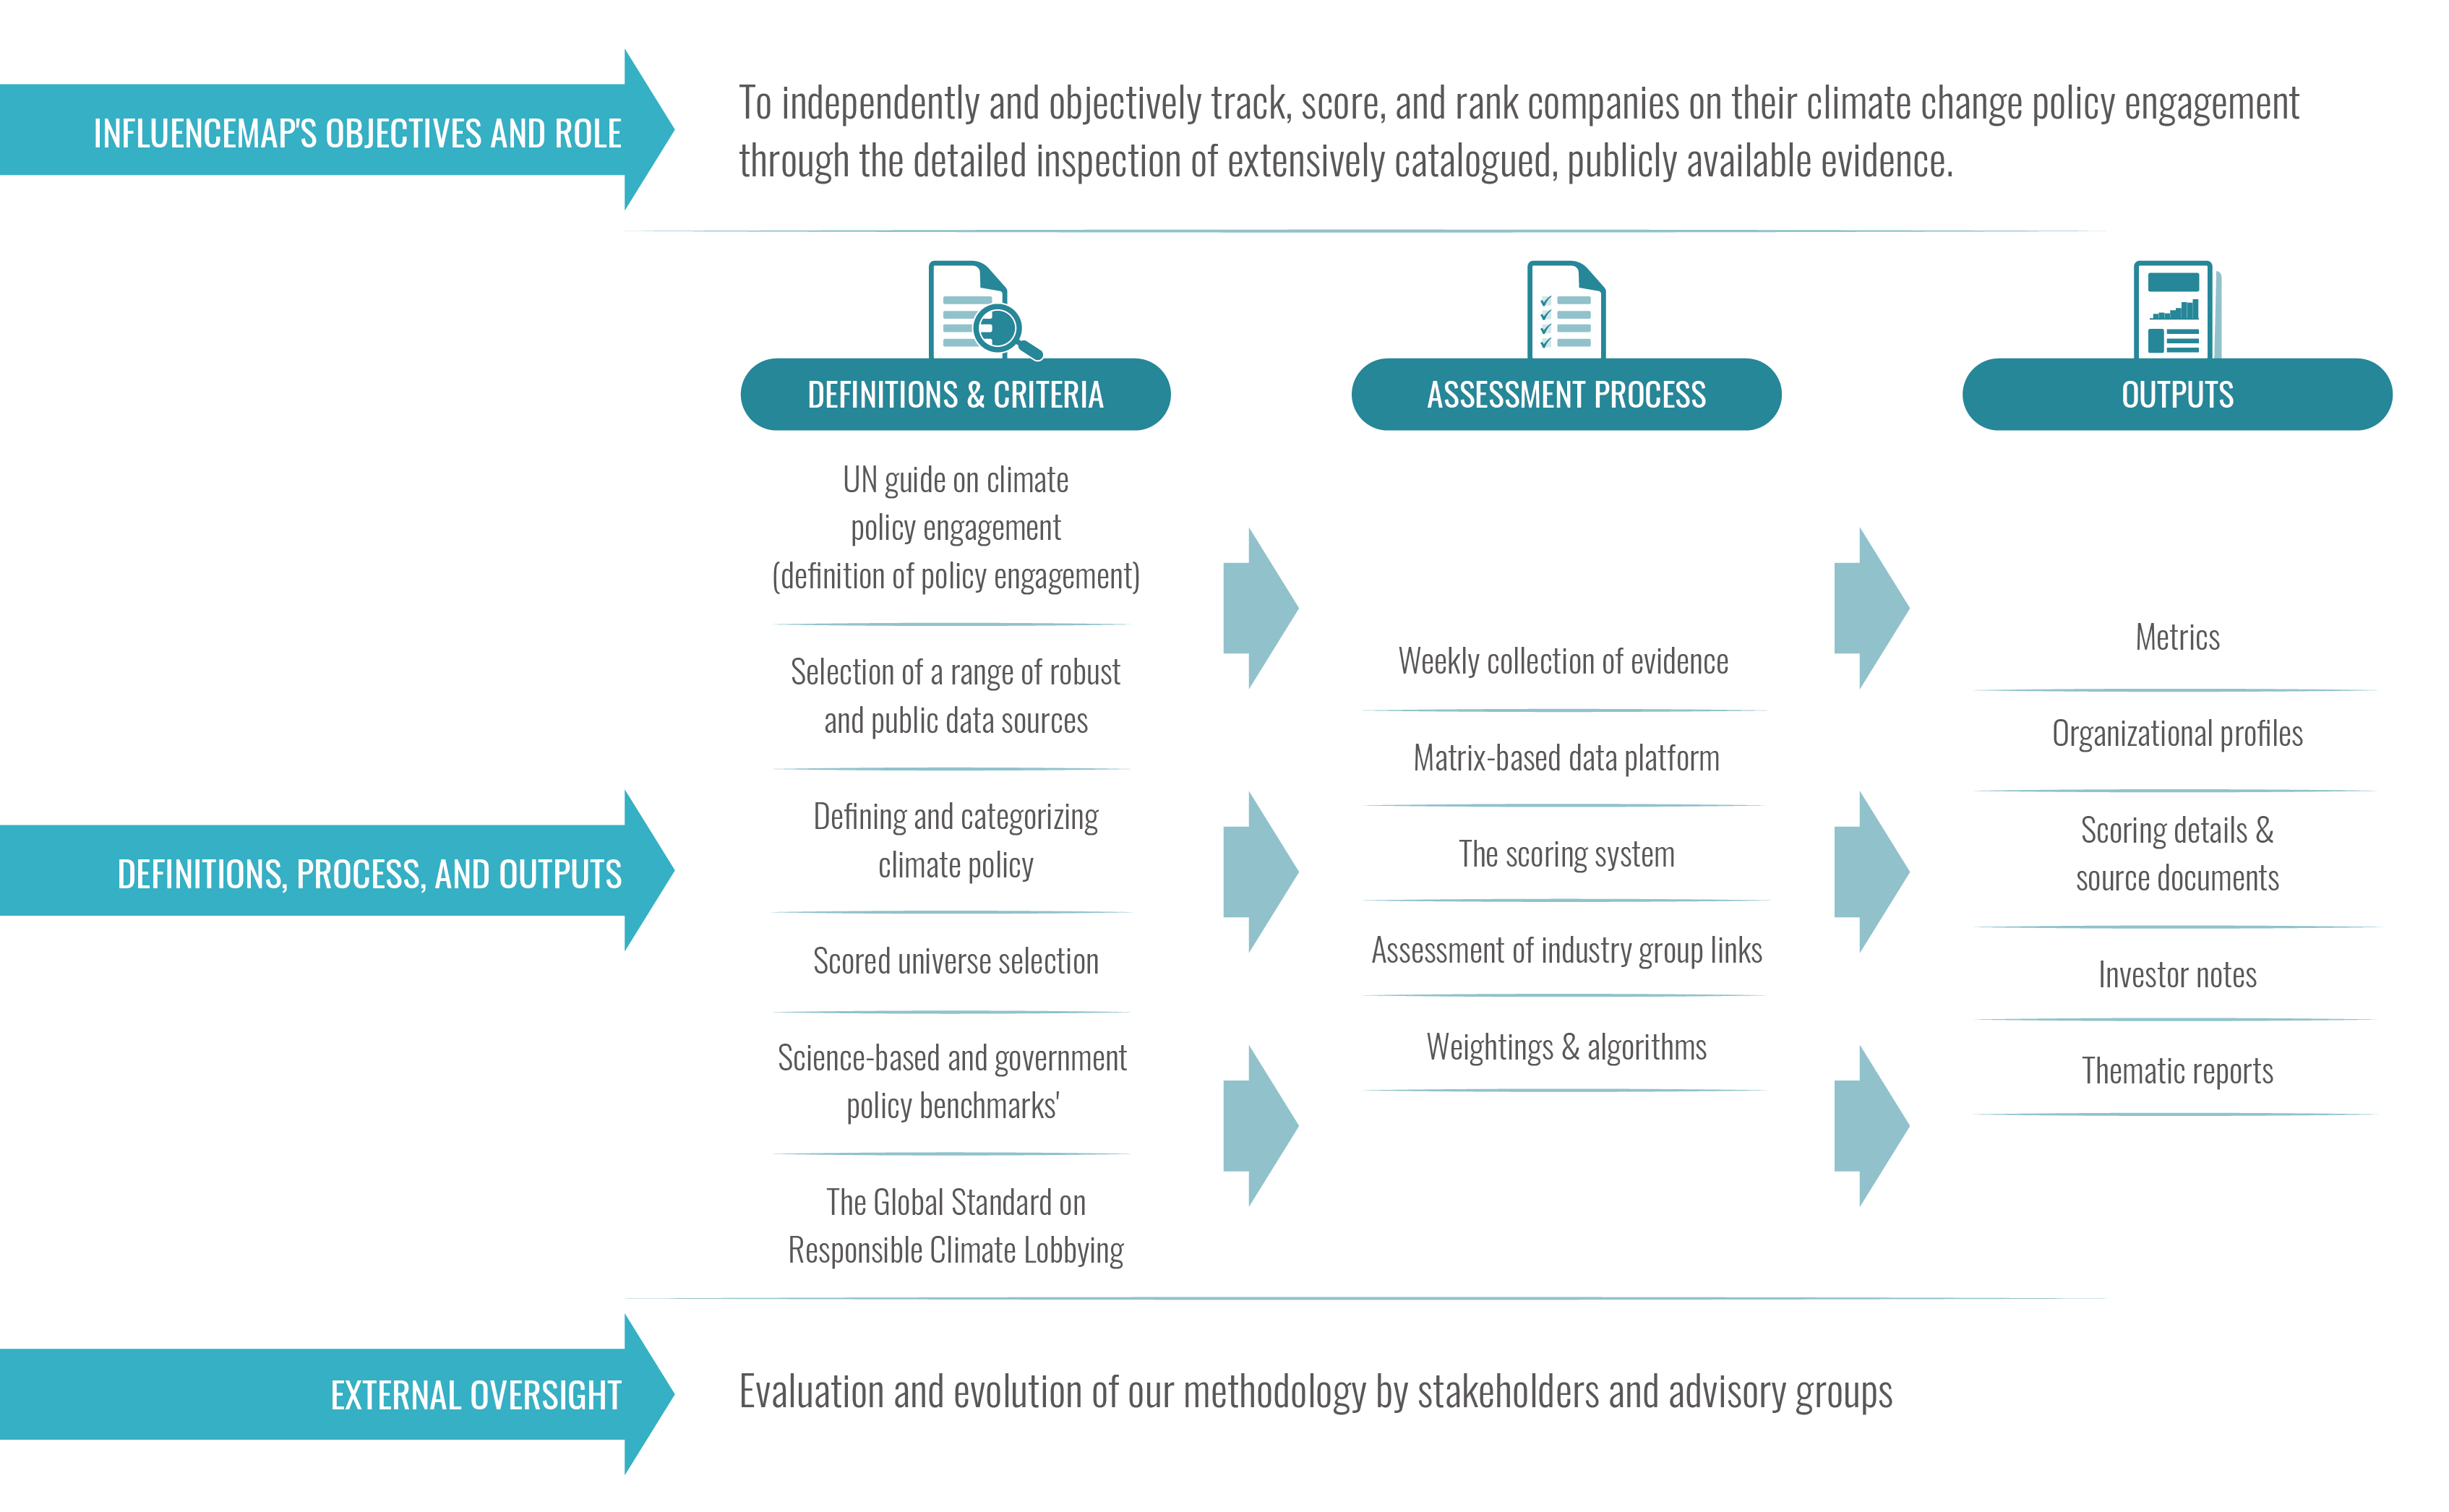
This page summarizes the LobbyMap platform's methodology for assessing companies and industry groups on their climate policy engagement for the benefit of our users and stakeholders.
The LobbyMap methodology adheres to key features of sound corporate assessment metrics: objectivity, transparency, ease of comprehension and use, and allowing for like-for-like comparisons across and within sectors.
The process is summarized as follows:
We would like to thank the following individuals for their guidance and assistance as members of our advisory group:
The LobbyMap platform scores and ranks companies on their activities to influence climate change policy. This process involves systematic data collection and thorough scrutiny of publicly available information. It does not require additional disclosures or cooperation from the entities under review.7
Academic research has recognized that voluntary disclosures through corporate sustainability reporting often present a somewhat misleading "top-line" or "front-stage" view of a company's activities related to sensitive issues like public policy engagement. 8
InfluenceMap addresses this by employing a clearly defined set of publicly available data sources that allow for in-depth examination of corporate climate policy engagement. The criteria for selecting these data sources are that they must be publicly accessible, applicable to all entities within our assessed universe, and reliable representations of corporate activities and behavior.
LobbyMap's evaluation of an organization relies on hundreds of pieces of scored evidence gathered from these sources, resulting in a representative assessment of whether the organization aligns its climate policy engagement with policy pathways highlighted by the Intergovernmental Panel on Climate Change (IPCC) to deliver the Paris Agreement’s target of limiting global temperature rise to as close to 1.5°C as possible. This assessment offers a much more comprehensive view than the high-level statements or commitments made by organizations.
The system produces objective and transparent analyses and metrics that facilitate meaningful comparisons between the companies and industry groups being evaluated. This provides:
InfluenceMap acknowledges the limitations of this research, which can serve as a foundation for further study in areas such as:
The LobbyMap platform assesses corporate and industry engagement with current, evolving, and anticipated future policies and regulations established by government bodies tasked with implementing the Paris Agreement. The term "corporate engagement with climate policy" encompasses a spectrum of corporate activities as defined in the UN Global Compact's Guide for Responsible Corporate Engagement in Climate Policy.
Credible, consensus-based, and internationally recognized scientific guidance is a critical resource for fighting misinformation that might derail urgently needed climate policy action. InfluenceMap's system measures corporate support or opposition to "science-aligned climate policy." This term denotes the policy and technology pathways highlighted through the research of the Intergovernmental Panel on Climate Change (IPCC) as necessary to deliver the Paris Agreement’s goal “to avoid dangerous climate change by limiting global warming to well below 2°C and pursuing efforts to limit it to 1.5°C.”
A core objective of the LobbyMap methodology is to assess the “alignment” of company policy positions with these pathways. To do this, InfluenceMap maintains a "policy-neutral" stance, refraining from taking positions or making judgments on the optimal forms of climate policy. Instead, the LobbyMap methodology relies on two authoritative external benchmarks to support its evaluations: science-based policy benchmarks and government policy benchmarks.
The United Nation’s body for climate science, the Intergovernmental Panel On Climate Change, has produced a series of recent reports on how to deliver these goals, including detailed guidance on technology pathways and needed policy interventions to limit warming to 1.5°C.” This guidance is the cornerstone of the LobbyMap methodology, providing the core science-based policy benchmarks against which corporate climate policy advocacy is assessed.
These are supported by government policy benchmarks, which are derived from the proposals and stated objectives of government entities entrusted with fulfilling a country's nationally determined contributions (NDCs) to global greenhouse gas emission reductions in alignment with the IPCC’s guidance. As such, the methodology accounts for regional nuances and context on different countries’ preferred route to net zero. Further details about these benchmarks and their application can be found in Appendix A.
The core set of metrics that the LobbyMap platform produces for each entity is set out in the table below. The interpretation guidance explains how each metric can be read in relation to the overall assessment of that entity's support or opposition to science-aligned climate policy.
| Score | Description | Interpretation Guidance |
|---|---|---|
| Organization Score (0–100) | Organization Score is a measure of how supportive or obstructive the company’s direct engagement is towards science-aligned climate policy. | A score of 0 would indicate full opposition, and a score of 100 equates to full support. Scores above 75 indicate broad consistency with, and support for, science-aligned policy for delivering the Paris Agreement's goal of delivering as close to 1.5°C warming as possible. Scores below 50 indicate increasingly significant misalignment between the company’s detailed climate policy engagement and policy that can meet the Paris Agreement's warming targets. Scores between 50 and 75 indicate mixed engagement with such policy. If limited evidence has been collected on a company's direct policy engagement, the Organisation Score is signified with an "n/a" (not available). |
| Relationship Score (0–100)* | Relationship Score is a measure of how supportive or obstructive the company’s industry associations are towards science-aligned climate policy. The Relationship Score is an aggregate assessment of the climate policy engagement of a company’s industry associations. This calculation accommodates an assessment of the strength of the relationship between a company and an industry association. For example, a stronger weighting will be attributed where a company has a representative on the board of an industry association. | A score of 0 would indicate full opposition, and a score of 100 equates to full support. Scores above 75 indicate broad consistency with, and support for, science-aligned policy for delivering the Paris Agreement's goal of delivering as close to 1.5°C warming as possible. Scores below 50 indicate increasingly significant misalignment between the detailed climate policy engagement of a company's industry associations and policy that can meet the Paris Agreement's warming targets. Scores between 50 and 75 indicate mixed engagement with such policy. If limited evidence has been collected on a company's industry association links, the Relationship Score is signified with an "n/a" (not available). |
| Performance Band (A+ to F) | Performance Band is a full measure of a company’s climate policy engagement, accounting for both its own engagement and that of its industry associations. For companies, the ‘Organisation Score’ and ‘Relationship Score’ are combined to result in a total score that places the company in a Performance Band. Industry associations do not have a ‘Relationship Score’, so the Performance Band for industry associations is made up of only the ‘Organisation Score’. | There are 16 Performance Bands from A+ (representing a total score from 95–100%) to E- (a score of 25–30%), with scores below 25% falling in the red "F" band. Grades from A+ to B (i.e., above 75%) indicate broad support for science-aligned policy for delivering the Paris Agreement's goal of delivering as close to 1.5°C warming as possible, with grades from D to F (i.e., below 50%) indicating increasingly obstructive climate policy engagement. If limited evidence has been collected on both a company's direct policy engagement (Organization Score) and industry association links (Relationship Score), the Performance Band is signified with an "n/a" (not available). |
| Engagement Intensity (0–100) | An independent measure of how active a company or industry association is in its direct climate policy engagement activities. This metric is independent of the Organization Score and Relationship Score and is "policy position agnostic." It provides a useful measure of the strategic importance an organization places on climate policy within its advocacy program. This metric applies equally to both companies and industry associations. | A score ranging from 0 to 100 indicates the intensity of policy engagement. A score above 12 indicates active engagement, while a score above 25 indicates highly active or strategic engagement. A score below 12 indicates relatively limited engagement. Entities with Engagement Intensity scores below 5 are not attributed an Organization Score. |
*Relationship Scores are generated for companies only. The remaining three metrics are generated for both companies and industry associations.
Higher quality corporate disclosures on climate policy engagement practices have become a key demand from the investment community, with “investor expectations” on this issue emerging from institutional investors and their convenors. InfluenceMap provides insight into the robustness of corporate direct disclosure on climate policy engagement activities by using investor expectations to structure its assessments.
In 2021, InfluenceMap developed a methodology to assess the quality of corporate disclosures on climate policy engagement, benchmarked against expectations set out in investor statements by Principles for Responsible Investment (PRI), Institutional Investors Group on Climate Change (IIGCC), and Ceres (members of the Climate Action 100+ (CA100+) secretariat). This methodology was used in InfluenceMap's April 2021 report on such corporate disclosures and has been used extensively by companies and investors since 2021.
In 2022, InfluenceMap conducted a series of pilot studies integrating additional indicators from the Global Standard on Responsible Climate Lobbying (henceforth “the Global Standard”) into these assessments. The Global Standard is the leading best practice framework for climate policy engagement disclosure, initiated by investors and launched in March 2022. The Global Standard sets out 14 indicators covering governance and oversight processes to ensure company alignment between their climate policy engagement and pathways to deliver the 1.5°C goal of the Paris Agreement, and clarifies exactly what investors expect from companies regarding disclosure.
In 2023, InfluenceMap’s methodology to assess corporate disclosures on climate policy engagement was formally updated in line with the Global Standard and stakeholder input. These assessments are directly integrated into the CA100+ Net Zero Company Benchmark as part of the “Climate Policy Engagement Alignment” assessment, under two distinct indicators:
Accuracy of Climate Policy Engagement Disclosures: An assessment of the accuracy of a company's reporting on its direct and indirect (via industry associations) climate policy engagement activities.
Robustness of Corporate Climate Policy Engagement Review & Misalignment Management Processes: An assessment of the quality and robustness of a company's process to identify, report on, and address specific cases of misalignment between its climate policy engagement activities and delivering the 1.5°C goal of the Paris Agreement.
Further information about these assessments can be found here .
InfluenceMap’s LobbyMap database is updated on a week-to-week basis. It covers a significant proportion of the corporate and industry association landscape, focusing on the companies and sectors that are most integral to delivering robust climate policy pathways.
Through the aggregation of evidence collected across the global database, InfluenceMap can track and analyze how the corporate sector is actively seeking to influence climate-related policy domains in real time. This monitoring allows us to pinpoint policies that are predominantly drawing attention from negative actors and thus may be at risk of weakening or obstruction. So far, InfluenceMap has developed dedicated platforms for real-time tracking of corporate and industry engagement with climate-related policy in Europe, the US, South Korea, Japan, and Australia, with more platforms in development.
The LobbyMap database also serves as a valuable tool for identifying and evaluating significant narratives that companies employ to influence climate policy. Utilizing InfluenceMap's Science-Based Benchmarking methodology, these narratives can be analyzed to determine the extent to which they may be misleading or contain misinformation.
7 InfluenceMap regularly engages the corporations and industry groups it assesses, and company profiles on the LobbyMap platform are open to the online submission of comments regarding the scoring at all times.
8 Cho, C. H., Laine, M., Roberts, R. W., & Rodrigue, M. (2018). The Frontstage and Backstage of Corporate Sustainability Reporting: Evidence from the Arctic National Wildlife Refuge Bill. Journal of Business Ethics, 152 (3), 865-886. doi:10.1007/s10551-016-3375-4
This section develops the ideas and concepts introduced in the previous chapter to define the main parameters of the research process.
Corporate climate policy engagement is associated with terms such as "lobbying," "advocacy," and "political activity," each carrying distinct connotations dependent on context. Two crucial sets of concepts merit consideration when defining "corporate climate policy engagement":
Inside vs. Outside: Academic literature distinguishes between various tactics employed by companies to influence public policy outcomes. Here, "inside" refers to efforts targeting policy influence through direct interactions with formal policy decision-makers (e.g., policymakers and politicians). "Outside" tactics, conversely, aim to shape public opinion as a means of achieving specific political and policy objectives.9
Direct vs. Indirect: This distinction pertains to the entity conducting climate policy engagement. "Direct" denotes engagement undertaken by the company itself, while "indirect" refers to engagement carried out on a company's behalf by third-party entities, such as industry associations, think tanks, or PR agencies. Direct and indirect climate policy engagement may employ either inside or outside tactics.
To minimize confusion, InfluenceMap relies on the 2013 "Guide for Responsible Corporate Engagement in Climate Policy," issued by the secretariat of the UNFCCC and the United Nations Environment Programme (UNEP) as part of the UN's Caring for Climate collaboration within the United Nations Global Compact (UN Global Compact). This document outlines a roster of corporate activities that constitute corporate climate engagement, encompassing inside, outside, direct, and indirect strategies.
These activities span advertising, social media, public relations, research sponsorship, direct engagement with regulators and elected officials, campaign funding, participation in policy advisory committees, and more. Typically, these efforts are coordinated by the regulatory affairs department within the company, but they may also involve PR, communications, and marketing/advertising functions. InfluenceMap captures the outcomes of these activities related to climate policy and regulations whenever they become publicly available.
InfluenceMap's methodology involves the identification of evidence related to corporate climate policy engagement, which is assessed against government and science-based policy benchmarks. The criteria for selecting data sources are as follows: sources must be publicly available, should ideally be applicable to all entities within our assessed universe, and must offer reliable insights into corporate activities and behaviors.
These criteria are generally applicable and accessible in the public domain for all large companies, with the exception of CDP (formerly known as the Carbon Disclosure Project) and financial disclosures, which do not apply to industry associations.
| Data Source | Description |
|---|---|
| Organizational Websites | The main organizational web site of the company and its subsidiaries. |
| Corporate Media | Additional media communications controlled by the organization, including social media channels. |
| CDP Disclosures | Responses to questions within CDP's system (12.3) related to climate policy engagement. |
| Direct Consultation with Governments | Comments from the entity submitted through official regulatory and legislative consultation processes or via meetings and other direct engagements with policymakers. This includes evidence obtained by InfluenceMap through Freedom of Information requests. |
| Reliable Media | Reports of corporate climate policy engagement by well-established media. |
| Management Messaging | Direct quotes or ranscripts of statements by an entity’s CEO/Chairman under a variety of circumstances. |
| Financial Disclosures and Investor Transcripts | Submissions by the company to financial regulators, as well as officially recorded transcripts of company-investor calls. |
| Lobbying Disclosures (Proposed)* | InfluenceMap is considering an additional data source to track and assess information provided by companies through government lobbying disclosure channels such as the EU Transparency Register. |
| Advertising (Proposed)* | InfluenceMap is considering an additional data source to track and assess the use of paid-for, targeted climate advertising (e.g., Facebook/Instagram/google adverts, advertorials, etc.) |
*Data sources labeled "Proposed" are under consideration for incorporation into the LobbyMap platform, following consultation and further development
These data sources encompass many, if not most, of the various aspects of corporate climate policy engagement discussed above. For instance, "Direct Consultation with Governments" (D4) includes specific "internal" lobbying tactics and serves as an essential means through which corporations and industry groups convey their positions on policy matters and desired outcomes. Such comments are often publicly accessible, particularly through platforms like the regulations.gov portal at the US federal level. InfluenceMap actively pursues Freedom of Information Act (FOIA) requests to access additional similar data sources.
Evidence of top management messaging (D6) under various circumstances indicates potential efforts to influence policy through high-level communications directed at key influencers. The utilization of social media channels (D2) and, increasingly, paid targeted social media advertising (newly introduced as D8) are immensely important "external" lobbying tools for companies and their industry groups. These tools enable companies to shape the public narrative on climate change.
It is worth noting that these data sources vary in availability across different regions and jurisdictions. Whenever InfluenceMap seeks to expand its system to encompass climate policy engagement in a new region, we conduct a comprehensive assessment, which includes stakeholder consultations to gauge data availability, and adapt our methodology accordingly.
The LobbyMap system can identify inconsistencies in corporate communications across various data sources. For instance, it can pinpoint instances in which a company's high-level corporate disclosures or public relations messaging through social media differ from the messages conveyed directly to government officials.
Our acknowledgment that the complete scope of corporate climate policy engagement might not be apparent in publicly available data sources is illustrated in Graphic 2. While the LobbyMap system does not encompass concealed or undisclosed information related to activities like private meetings and financial transactions, it does seek to provide a robust and statistically relevant account of corporate and industry group behavior by collecting and accessing the largest possible number of publicly accessible data points.
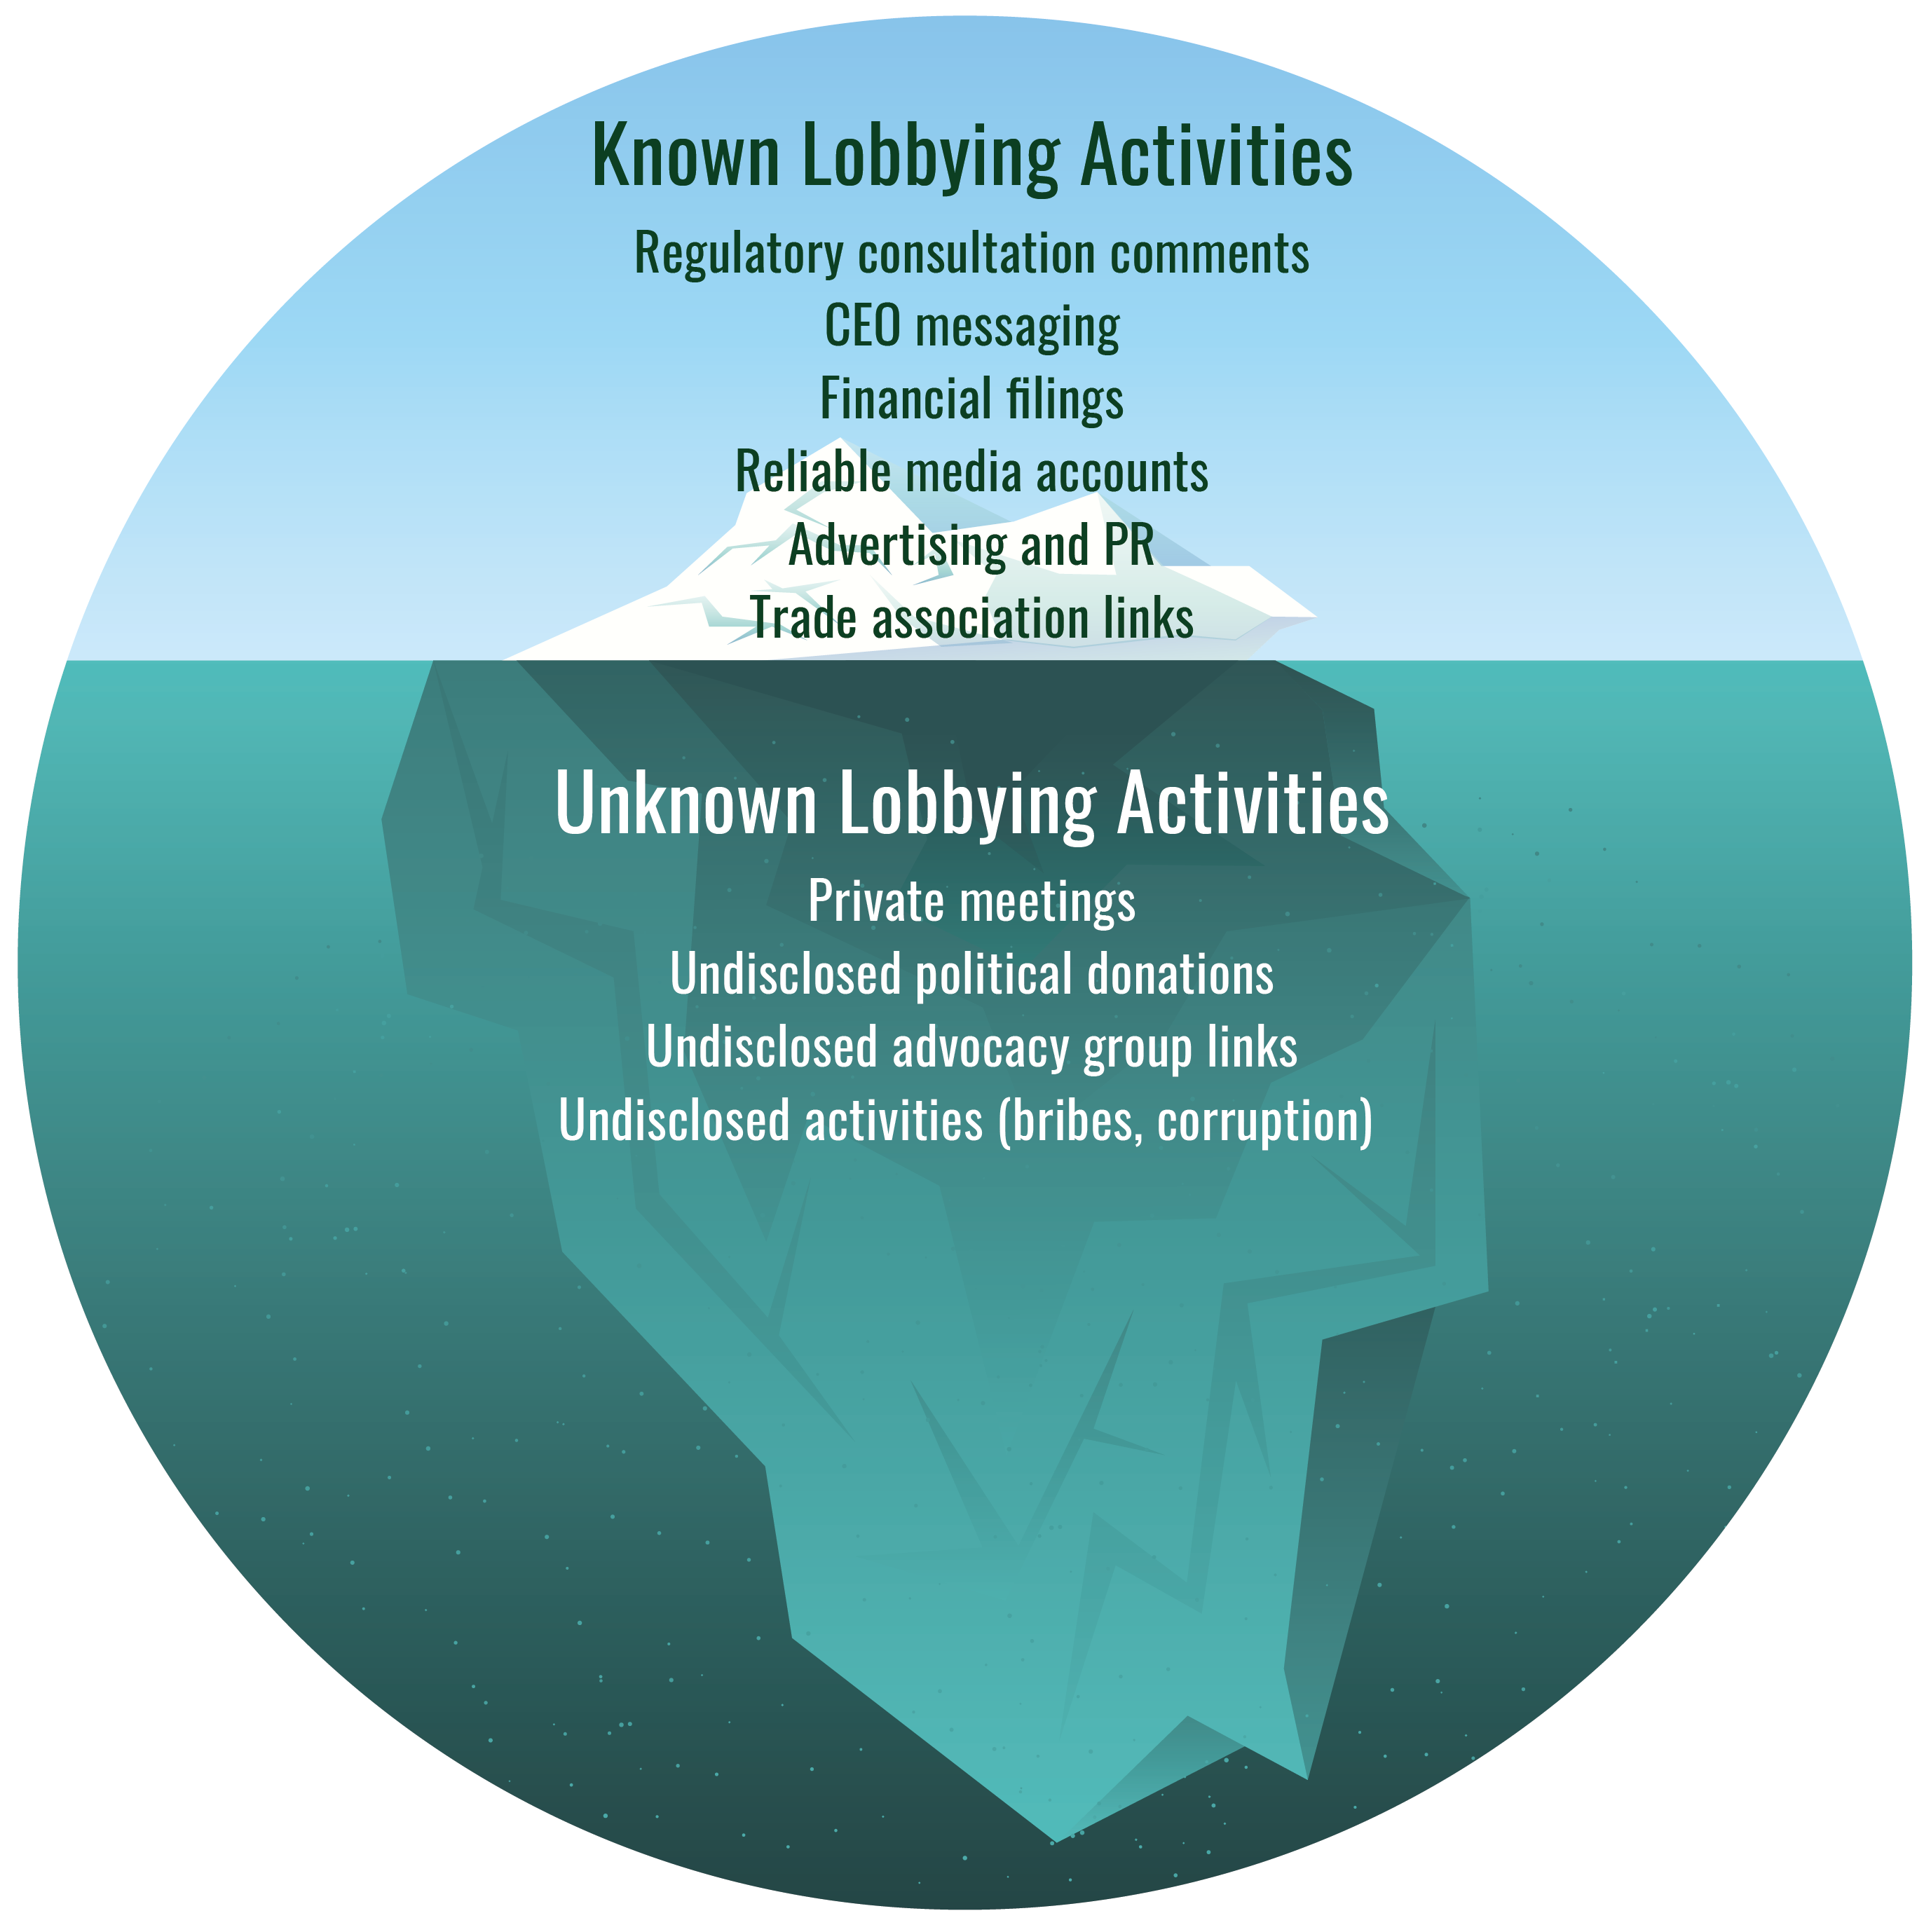
Graphic 2: Iceberg graphic depicting known and unknown lobbying activities by the corporate sector.
The UNFCCC process (including IPCC guidance) has triggered climate-motivated policy and regulatory processes from government regulators. The Paris Agreement commits signatories to develop Nationally Determined Contributions (NDCs), in which nations outline their implementation plans to meet the Agreement’s goals. The LobbyMap system considers existing, evolving, and likely future policy measures issued by mandated bodies. "Mandated bodies" are defined here as various levels of government or government-authorized bodies that are tasked with NDC implementation in their regions.
| Type | Policy Category | Description |
|---|---|---|
| High-level | Climate Science | Transparency around climate change science |
| High-level | Climate Science Stance | Position on the needed response to climate change science |
| High-level | Need for Climate Regulation | Support for regulations to tackle climate change in general |
| High-level | The UN Climate Process | Support for the UNFCCC process on climate change |
| Policy-level | Carbon Tax* | Support for policies/regulation on this topic |
| Policy-level | Emissions Trading* | Support for policies/regulation on this topic |
| Policy-level | Energy & Resource Efficiency | Support for policies/regulation on this topic |
| Policy-level | Renewable Energy* | Support for policies/regulation on this topic |
| Policy-level | Energy Transition & Zero Carbon Technologies* | Support for policies/regulation on this topic |
| Policy-level | GHG Emission Regulation | Support for policies/regulation on this topic |
| Policy-level | Carbon Sinks | Support for policies/regulation on this topic |
| Disclosure & Transparency | Direct Policy Engagement | Transparency on positions and activities to influence climate policy/legislation |
| Disclosure & Transparency | Indirect Policy Engagement | Transparency on industry association relationships and their policy engagement activities |
*Following consultation, InfluenceMap will consider updating the categorization of policy that currently fits into these subcategories to better reflect the evolving real-world climate policy context.
The climate policy measures covered in the assessment encompass a spectrum of actions, ranging from high-level statements of intent to detailed and prescriptive legislation. They include the establishment of targets, implementation standards, fiscal interventions, and other binding regulatory requirements. Climate considerations are also increasingly influencing policy areas that are not traditionally associated with climate, such as building codes, land use policy, trade policy, and fiscal regulations. The climate-related components within these policies fall under InfluenceMap's definition of “Climate Policy.”
InfluenceMap breaks down the climate policy engagement agenda into a series of subcategories. The evidence we gather of corporate engagement with these climate policy subcategories builds a full picture of corporate interaction across the climate policy agenda.
The “high-level” categories capture engagement with broad issues that inform the wider context and narratives surrounding climate policy action. The “policy-level” categories capture engagement on specific legislative and regulatory strands that may be present at a regional level. For example, the “Carbon Tax” category archives corporate engagement with a range of policy strands in different regions that function as a tax on CO2 emissions.
Additionally, two subcategories are employed to assess the clarity, accuracy, and comprehensiveness of corporate governance and climate policy engagement disclosures. Evidence in these subcategories is benchmarked against the indicators outlined in the Global Standard on Responsible Climate Lobbying.
The above queries are altered for InfluenceMap's assessment of the financial sector. Please see Appendix B for further details.
As of September 2024, the LobbyMap platform covers approximately 600 companies and 300 leading industry groups, while also tracking the connections between them.
The extensive nature of the LobbyMap analysis has previously presented challenges to scaling the universe of analyzed companies in line with other organizations collecting data on corporate climate performance (for example, CDP’s database covers nearly 15,000 companies).
However, with advancements in new artificial intelligence (AI) and machine learning techniques, InfluenceMap is exploring ways to enhance the research process's efficiency without compromising the depth and accuracy of the research. Our current objective is to reach 1000 companies in 2025.
Our system for selecting companies prioritizes the largest companies as determined by the Forbes Global 2000, which aggregates a range of indicators relevant to economic size and political influence. The LobbyMap platform initially selects companies based on an average of their performance on the Forbes 2000 list over the past three years. Approximately 50% of the companies in InfluenceMap's database rank higher than 500 on their average Forbes ranking over this time, with 70% ranked higher than 1000.
In addition to size, the selection process has considered each company's likely relevance to climate change in LobbyMap's regions of focus. As a result, the database emphasizes:
A key area of future growth for the LobbyMap platform relates to companies headquartered in low and middle income countries with large economies that will be critical for addressing the climate crises. In particular, we are currently in the process of broadening our focus to include China, Brazil, India, Indonesia, Mexico, and South Africa.
LobbyMap is also expanding its coverage of finance sector companies and industry associations, with a slightly modified methodology (see Appendix B).
InfluenceMap refers to industry groups, business federations, and other similar groups representing corporate interests as "influencers." Where possible, InfluenceMap captures the additional influence that companies have via third-party groups. This analysis currently focuses on the role of industry associations for the following reasons:
In selecting the scoring universe for industry groups, the following criteria are used:
Since its launch in 2015, the LobbyMap platform has been used extensively by investors to evaluate and engage with companies regarding their climate-related policy influence activities. This area is increasingly recognized as a significant concern for mainstream investors. This heightened interest can be partially attributed to the inclusion of climate policy engagement as a central focus of the Climate Action 100+ (CA100+) initiative. CA100+ is a voluntary investor effort comprised of 700 investors responsible for managing over $68 trillion in assets. Its mission is to ensure that the world's largest corporate greenhouse gas emitters take the necessary actions to address climate change.
In March 2022, a coalition of investor networks and institutions—led by AP7, BNP Paribas Asset Management, and the Church of England Pensions Board—introduced the Global Standard on Responsible Climate Lobbying, referred to as "the Global Standard." This standard builds upon prior workCH1 and formalizes investor expectations. Notably, it represents the collective input of organizations such as the UN Principles for Responsible Investment (UN PRI), the Institutional Investors Group on Climate Change (IIGCCCH2 CH3 ), and Ceres (members of the CA100+ secretariat). The Global Standard outlines 14 indicators that encompass governance and oversight processes and are aimed at ensuring that companies align their climate policy engagement with the 1.5°C goal established by the Paris Agreement.
The Global Standard clarifies exactly what investors expect of companies regarding disclosures related to climate policy engagement. Its primary objective is to drive a significant shift in both investors’ and companies’ commitments towards engaging with climate policy that aligns with the goals of the Paris Agreement.
The LobbyMap platform's corporate and industry association assessments depend on the aggregation of up to several hundred individually assessed items of evidence collected on each entity’s climate policy engagement activities. The range of data sources and different categories of climate-related policy used to collect and organize this evidence are described in Section 3. This chapter explains the assessment that is applied to the evidence.
InfluenceMap’s analysis of climate policy engagement incorporates two types of assessment:
An assessment of the “alignment” of an entity’s policy positions and advocacy with policy to deliver the Paris Agreement’s goal to “avoid dangerous climate change by limiting global warming to well below 2°C and pursuing efforts to limit it to 1.5°C.”
An assessment of the “intensity” of an entity’s advocacy and engagement positions to promote these positions.
Both assessments are run across our entire database of companies and industry associations. This allows for the creation of a series of core metrics that describe the positioning and intensity of each entity’s “direct” climate policy engagement. Here, the word “direct” is being used to describe policy engagement that an entity undertakes itself.
Section 4.9 below further explains how the LobbyMap platform tracks relationships between companies and industry associations. This process, coupled with the alignment assessments of each industry association, enables a further set of calculations to determine the alignment of a company’s “indirect” policy engagement via the industry associations of which it is a member.
The following sections explain the LobbyMap platform's methodology for assessing company and industry association support for or opposition to science-aligned climate policy.
To remove subjectivity and value judgements from LobbyMap’s scoring process, all evaluations made under this system are done according to strict processes that compare the subject matter to external and authoritative standards. InfluenceMap refers to this process as “benchmarking.” The LobbyMap process benchmarks each individual item of evidence collected pertaining to a company or industry association’s climate policy engagement.
The methodology is designed to reflect two processes fundamental to the United Nations Framework Convention on Climate Change (UNFCCC)’s efforts to deliver the goals of the Paris Agreement to “avoid dangerous climate change by limiting global warming to well below 2°C and pursuing efforts to limit it to 1.5°C.”
The development of consensus-based scientific analysis on the best ways to deliver the Paris Agreement’s goals by the UN’s scientific body for advancing climate science, the Intergovernmental Panel on Climate Change (IPCC).
Efforts by nation states that have signed the Paris Agreement to devise and implement commitments set out in their National Determined Contributions by proposing and developing climate policy and regulations that consider a range of political, geographical, and economic conditions specific to their country.
These two processes directly correspond to the two sets of benchmarks used in the LobbyMap analysis, set out in the table below.
| Benchmark | Source | Description | Application |
|---|---|---|---|
| Science-Based Policy Benchmarks | Intergovernmental Panel on Climate Change (IPCC) | Summaries of the IPCC on particular technology and policy pathways to decarbonize different aspects of the global economy | Entity engagement with high-level policy issues relevant for the climate transition* |
| Government Policy Benchmarks | Government Websites and Announcements | Policy and regulatory proposals from government bodies mandated to deliver greenhouse gas (GHG) emission reductions in line with a country’s Nationally Determined Contribution | Entity engagement with specific climate-related policy and regulatory proposals* |
*Additional guidance about how these benchmarks are applied in practice can be found in the following sections.
Using two sets of authoritative and external benchmarks has a number of important benefits:
The scoring process applies to each individual item of evidence collected on an entity’s climate policy engagement. It determines the level of support or opposition a company or industry association has shown on a particular climate policy or policy-related issue in the evidence provided. This relies on a systematized process of discourse analysis that codes each evidence piece as: “Strongly supporting”; “Supporting”; “No position/Mixed position”; “Not supporting”; or “Opposing.” These codes correspond to a numerical five-point scale between +2 and -2, as demonstrated in the table below.
The level of “support” or “opposition” is determined by the extent to which there is alignment between the corporation’s position and the relevant benchmark. Strong alignment with the benchmark indicates strong support for the relevant climate policy or climate policy-relevant issue and therefore achieves a high score (2+), while strong misalignment with the benchmark indicates opposition to the relevant climate policy or climate policy-relevant issue and therefore earns a low score (-2).
Using a five-point scale enables a more nuanced analysis of the gray areas within corporate positioning on climate policy. Thus, the LobbyMap analysis can capture the full range of climate policy positioning, from pushing for greater ambition and constructive critique, to highly conditioned or limited support, to outright opposition.
| Science-Based Policy Benchmark | Score | Government Policy Benchmark |
|---|---|---|
| Detailed position that is aligned with IPCC analysis | 2+ | Strong support for the policy and/or advocacy that would strengthen the policy further |
| Broad alignment with IPCC analysis | 1+ | General or high-level support for the policy |
| Unclear if position is aligned with IPCC analysis | 0 | Unclear if position is supportive of the policy |
| Position appears misaligned with IPCC analysis | -1 | Unsupportive of the policy and/or communicates support for the policy but with major caveats and/or conditions that would weaken the strength of the proposal |
| Position contradicts IPCC analysis | -2 | Opposes the policy |
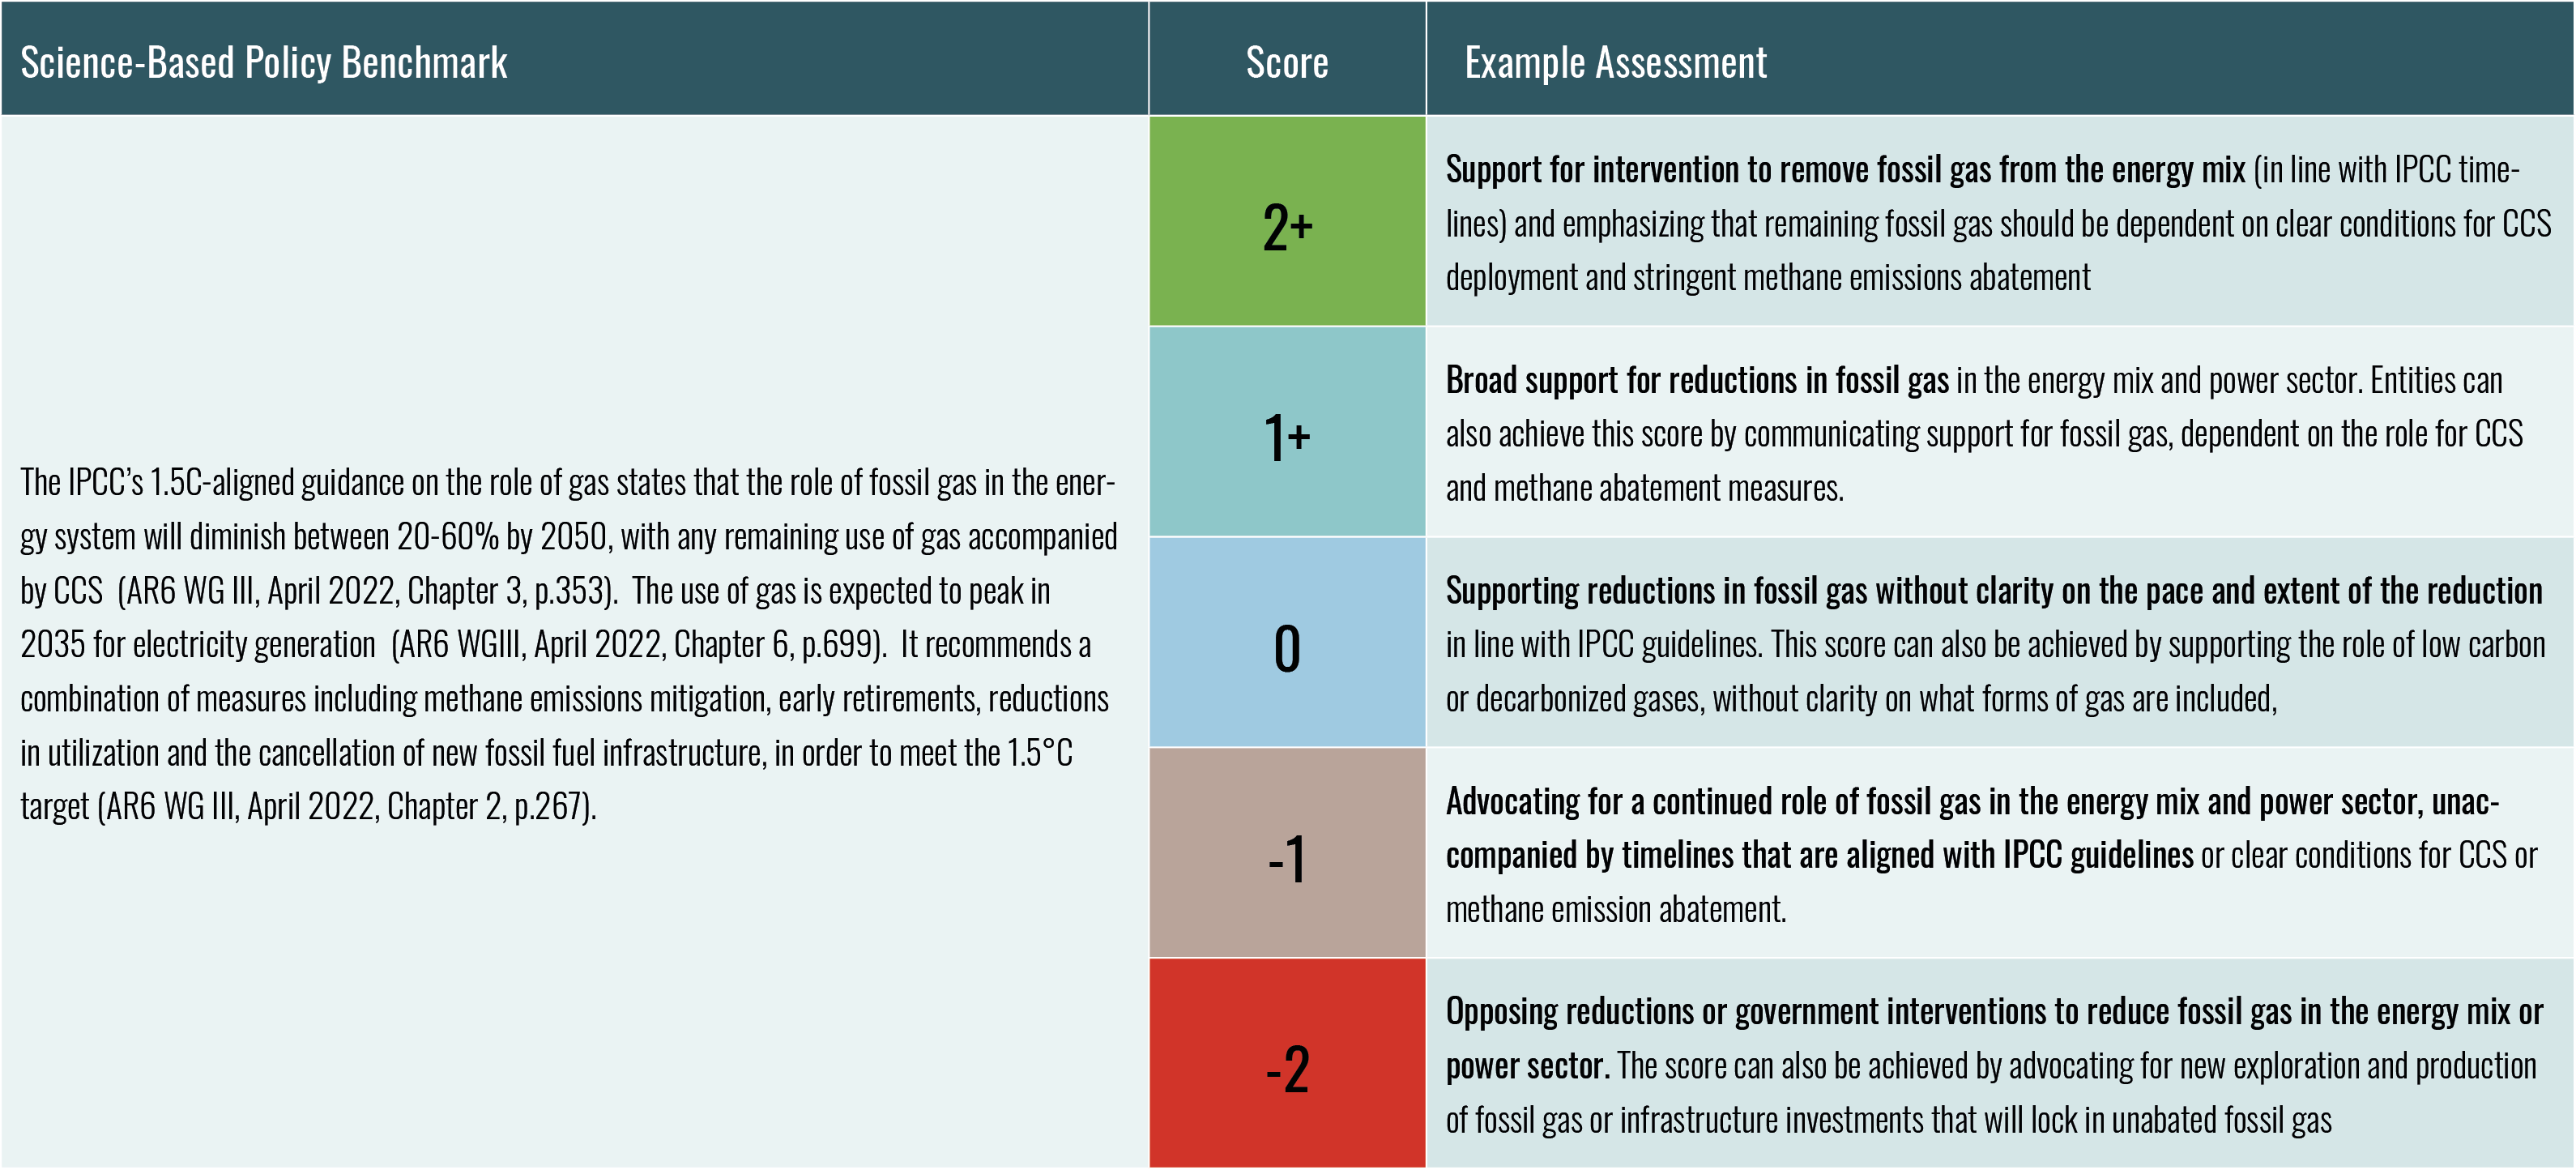
For the purposes of illustration, the table below provides a summarized example of one of InfluenceMap's science-based policy benchmarks on the role of fossil gas in the energy mix. Further explanation of how these benchmarks are applied is covered in the following section. To explore more science-based policy benchmarks used by the LobbyMap platform, please use InfluenceMap's Science-Based Benchmark Portal.
The result of this process is up to several hundred individually benchmarked and scored items of evidence on a company or industry association’s climate policy engagement. Using a matrix-based data platform (Section 4.6), this data is aggregated to produce each entity’s core metrics (Section 2.3).
Since the LobbyMap platform and methodology was first devised in 2015, the IPCC’s science-based guidance on climate mitigation has become increasing detailed on the types of policy action and technology pathways that are needed to deliver the Paris Agreement’s goals. In addition, as concerns around greenwashing have grown, so have civil society’s, investors’, the media’s, and the public’s expectations of companies to align their operations, business models, and advocacy activities with science-based pathways for addressing the climate crisis.
In response to these trends, InfluenceMap has shifted the balance of the LobbyMap system to focus on its science-based policy benchmarks. The majority of evidence collected on corporate and industry association climate policy engagement is now assessed against our science-based policy benchmarks by default. The exceptions relate to evidence of company or industry association engagement with specific and clearly communicated government policy proposals that are issued by government bodies mandated to act on climate in the particular region. In such a case, the relevant government policy benchmark will take precedence.
In practice, science-based policy benchmarks are used to assess instances of corporate policy engagement such as:
Further information on how science-based policy benchmarks are derived from IPCC reporting and analysis can be found in Appendix A. A selection of InfluenceMap’s science-based policy benchmarks can be viewed via the Science-Based Benchmark Database.
InfluenceMap’s government policy benchmarks are founded in “policy neutrality.” This means that the system does not evaluate the quality of governmental policy measures, but instead, after confirming that there is no clear inconsistency with IPCC guidance on Paris-aligned policy pathways, rests on the assumption that the policy proposals and ambitions from government bodies mandated to implement the Paris Agreement constitute the most authoritative, real-world set of standards for benchmarking corporate policy engagement.
InfluenceMap utilizes government policy benchmarks to score corporate and industry association engagement on climate policy when:
In addition to the scoring process above, the LobbyMap assessment process applies tags and records secondary metrics to capture various types of additional information within each evidence item assessed. These include:
Information on the region and date of each evidence item is recorded so the dataset can be analyzed from various angles, such as variation over time and region. Similarly, tags are applied to log evidence that refers to specific policies/laws, technologies, fuel types, or key themes, such as environmental justice and a just transition.
The “importance” of each evidence item is also assessed on a scale from 0 to 10. This captures the relative significance of an evidence piece compared to others from the same data source that cover the same policy issue. This helps distinguish between evidence of high-level statements with limited potential impact and evidence of direct and detailed engagement with policymakers.
Flag or star tags highlight positive and negative evidence pieces of high significance to the system’s users. Principally, flags and stars signify an item of evidence that shows strategic policy engagement from the company in either a highly supportive or oppositional manner.
The LobbyMap platform captures and assesses over 30,000 items of evidence each year, producing metrics and analysis on the climate policy engagement activities of the 1000 companies and 330 industry associations in the system. The following section describes the practical details of the assessment process and its implementation.
As outlined above, the primary sources of this evidence consist of a varied range of structurally irregular documents, text, and recorded commentary. All of these sources are stored on the LobbyMap system, requiring the archiving of large volumes of data in PDFs, text comments, and external URLs. As of January 2024, the system has archived over 150,000 evidence pieces online.
Each item of relevant evidence from these documents is assessed and tagged according to the processes described above, producing multiple useful data points. As such, in aggregate, the LobbyMap platform contains well over a million datapoints on corporate and industry climate policy engagement globally.
To effectively analyze and understand this level of complexity, it is necessary to arrive at meaningful high-level metrics and summary assessments for each company and industry group. To organize and process the data, InfluenceMap has designed a unique data architecture supported by bespoke software based on a MySQL database system, with both operator content management systems (CMS) and user-friendly displays to communicate the results.
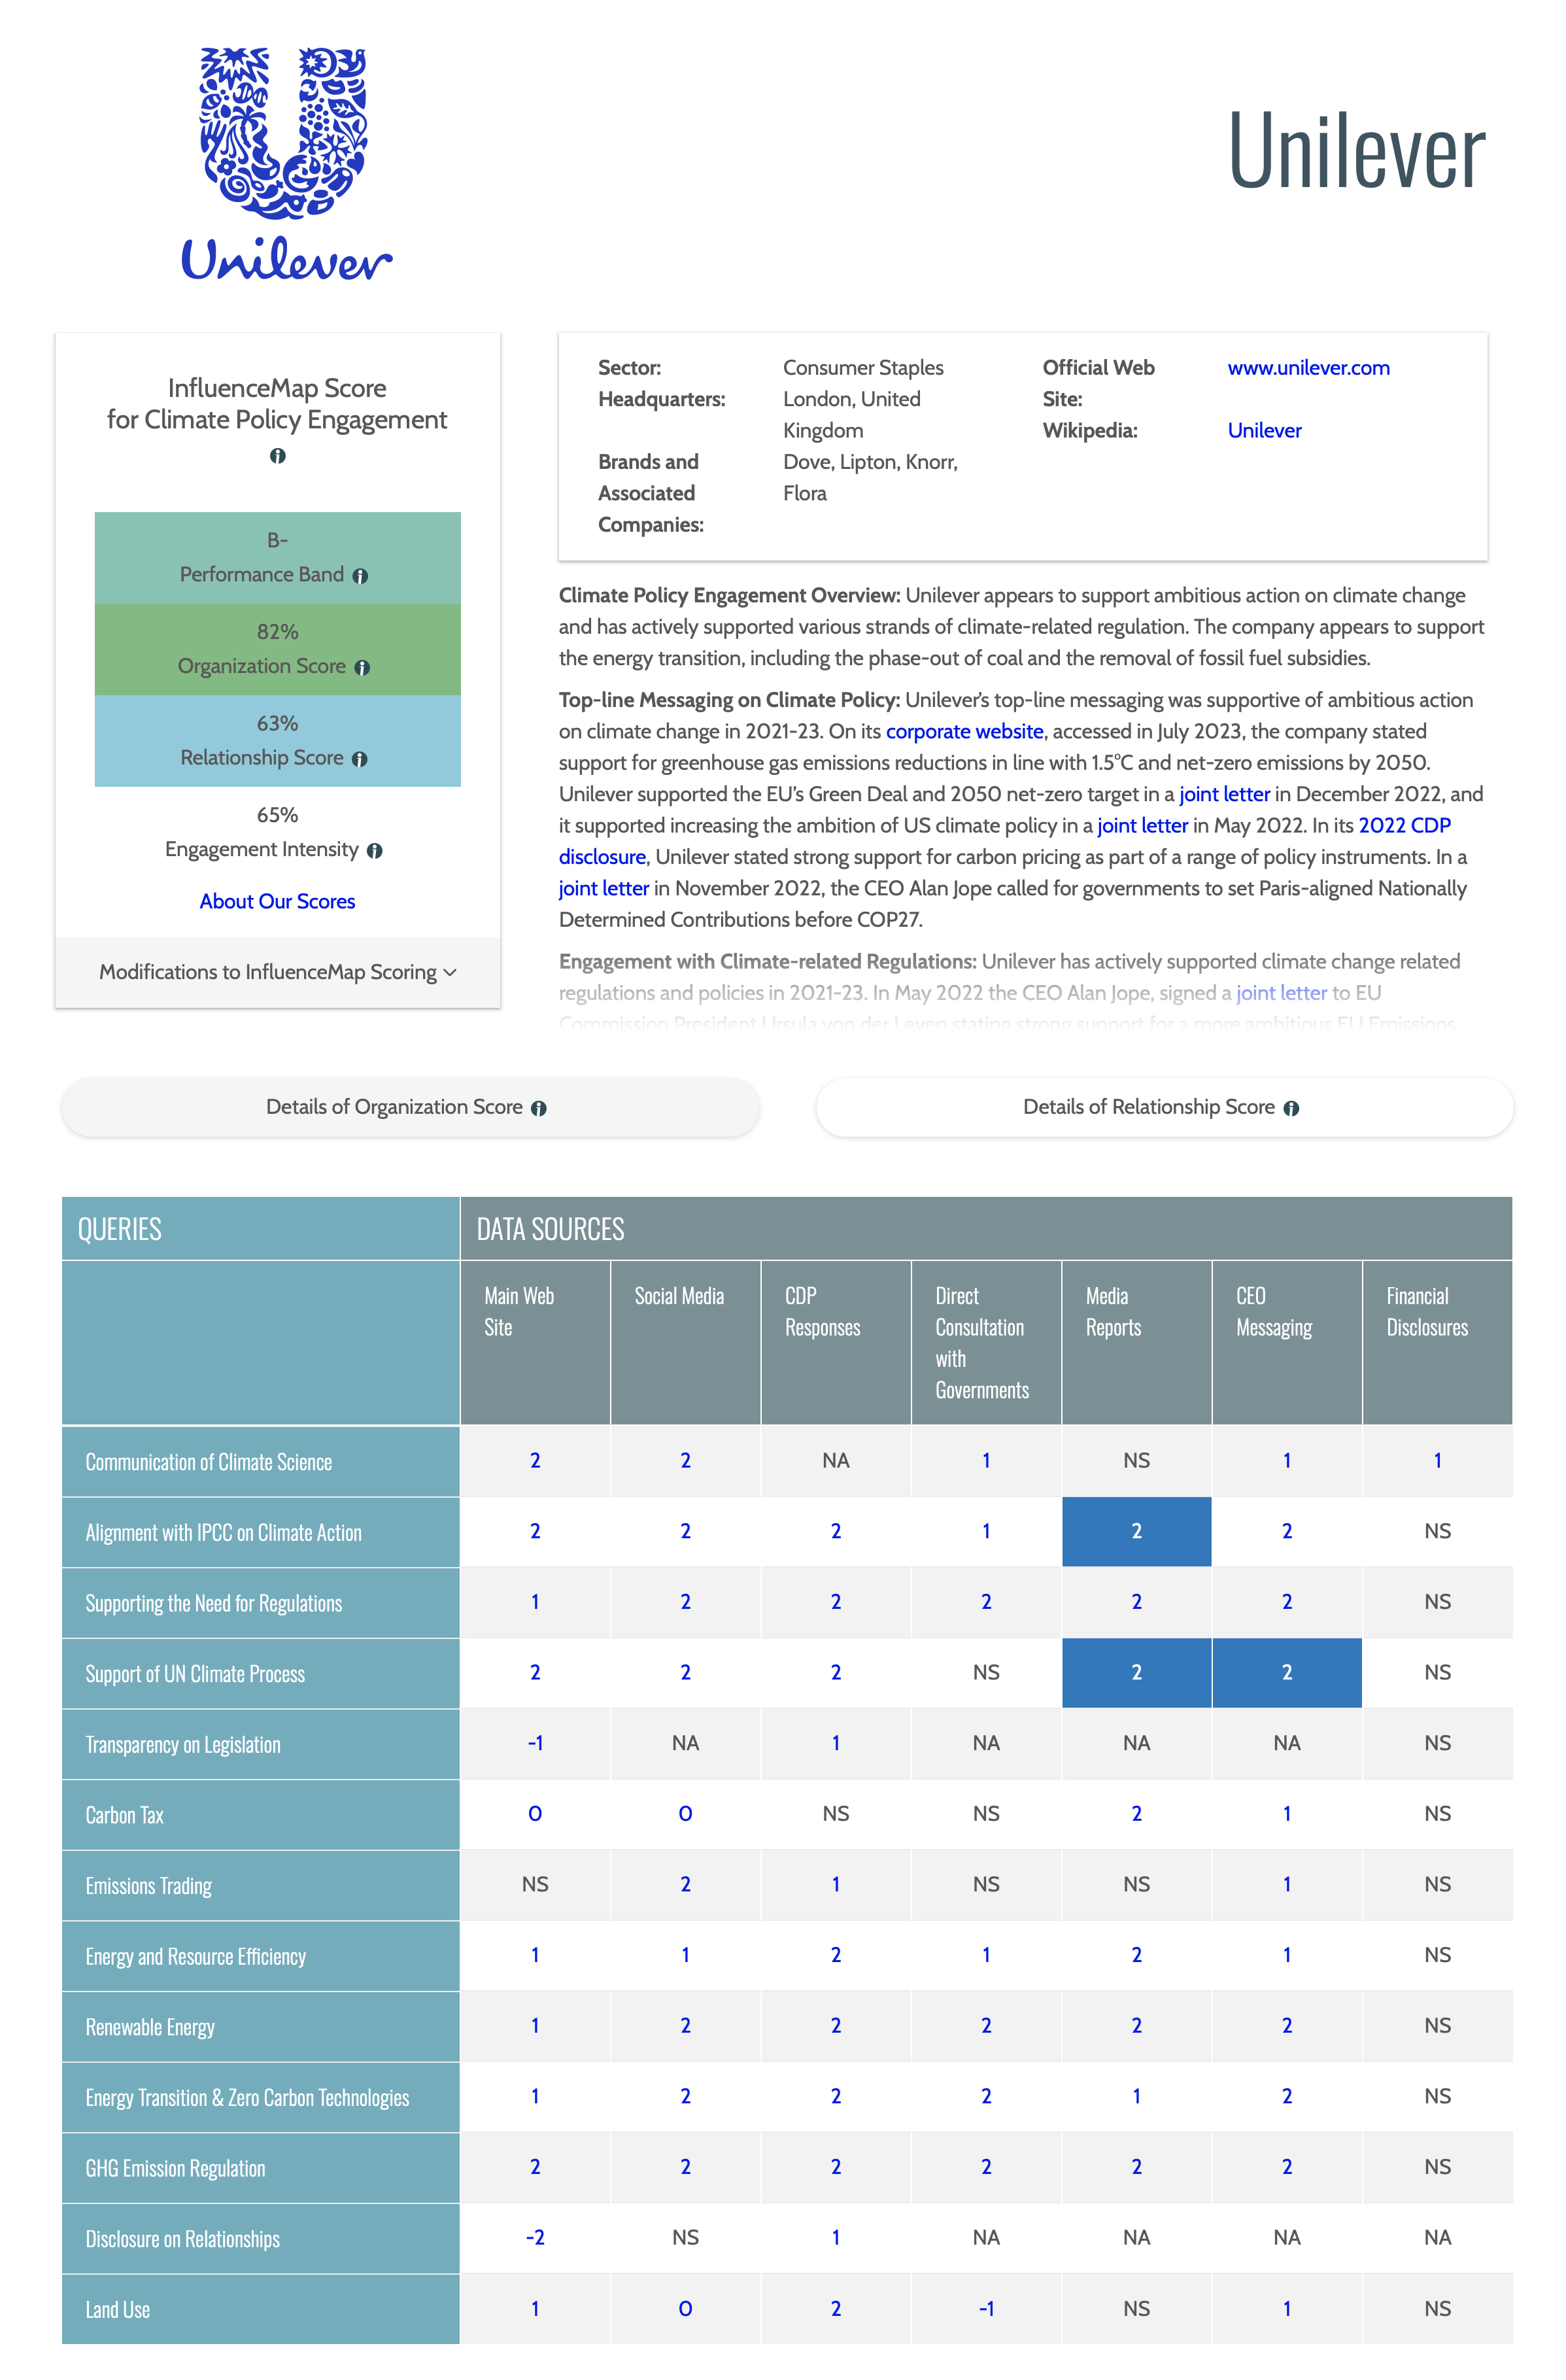
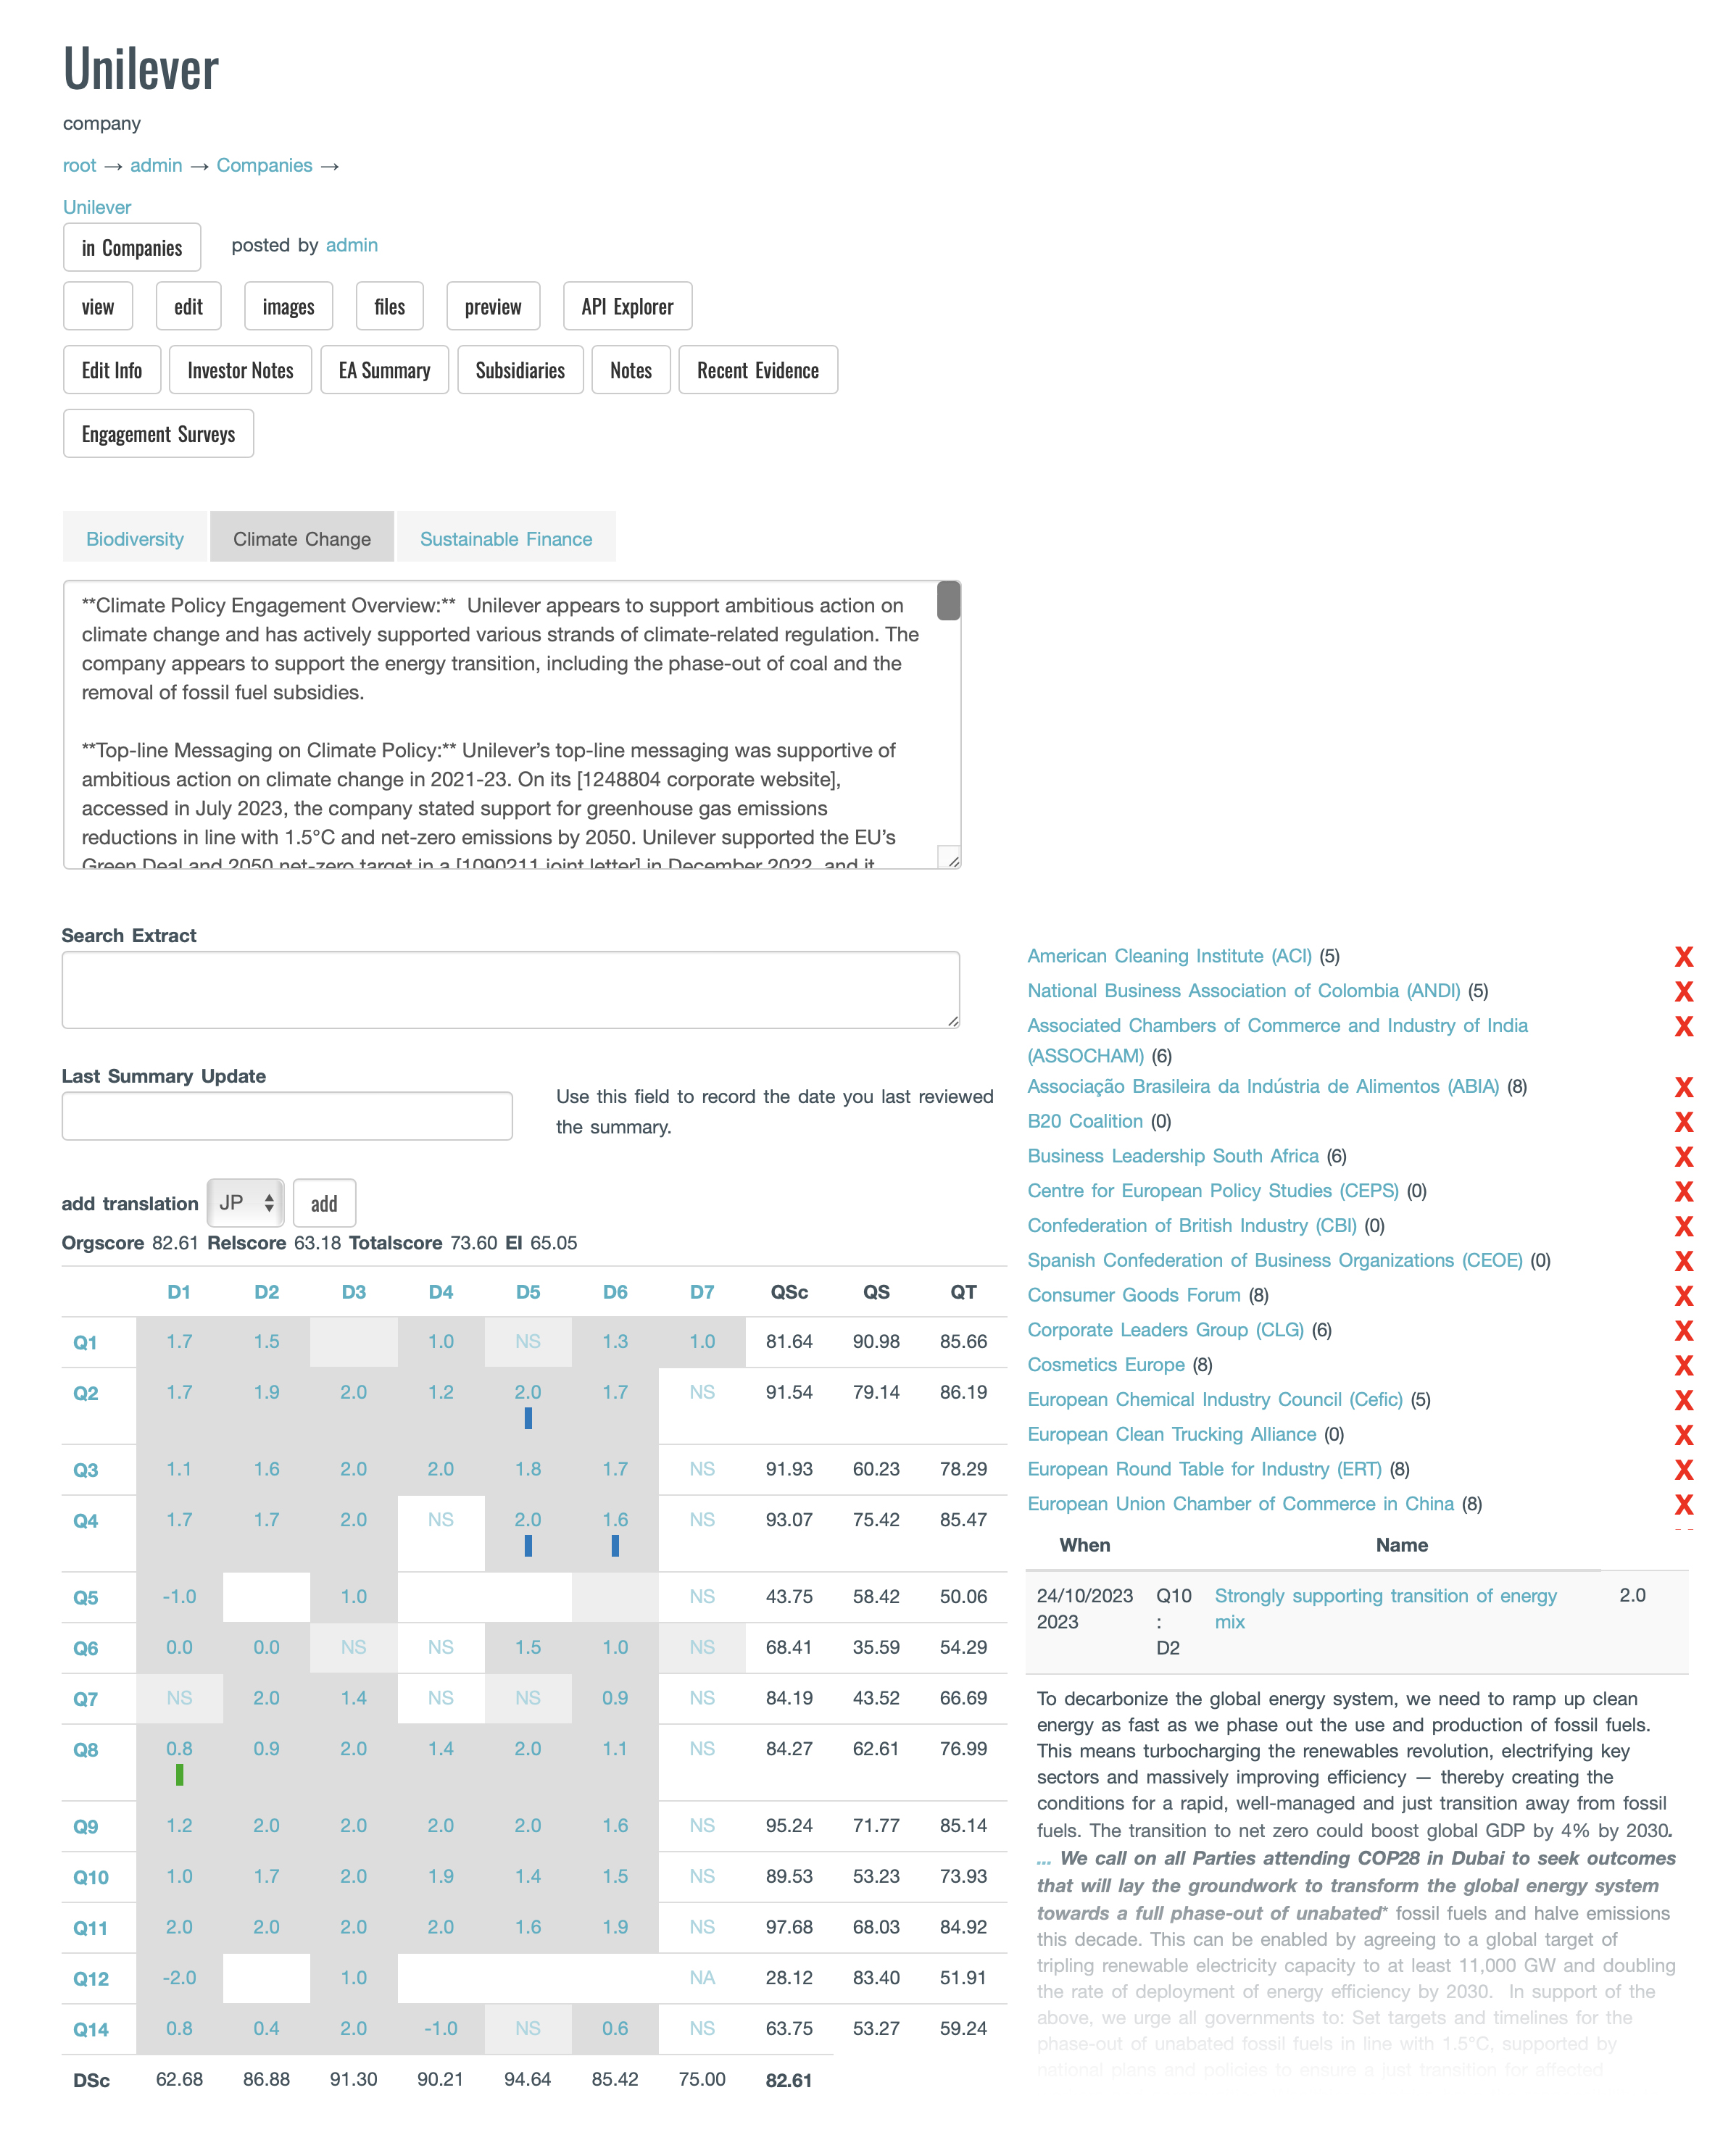
Unilever’s profile, shown in Graphic 3, provides an example of both the CMS and user displays for an identical part of the platform. It shows the matrix feature of the assessment software that allows for efficient archiving and clear communication of large amounts of data.
This matrix structure and hierarchical organization of data allows for a flexible and scalable platform, making the information clearly available for a range of users. It includes:
High-level metrics summarizing overall results of the analysis in a simple and comparable way, covering assessments of the intensity and alignment of the company’s direct policy engagement, as well as an analysis of its indirect policy engagement via industry associations.
A summary of InfluenceMap's scoring, which explains the analysis of each entity and offers an overview of the key data points impacting the high-level metrics.
The matrix in the public-facing graphic, which splits the climate agenda into InfluenceMap’s queries in the far left column, with the data sources labeled along the top row.
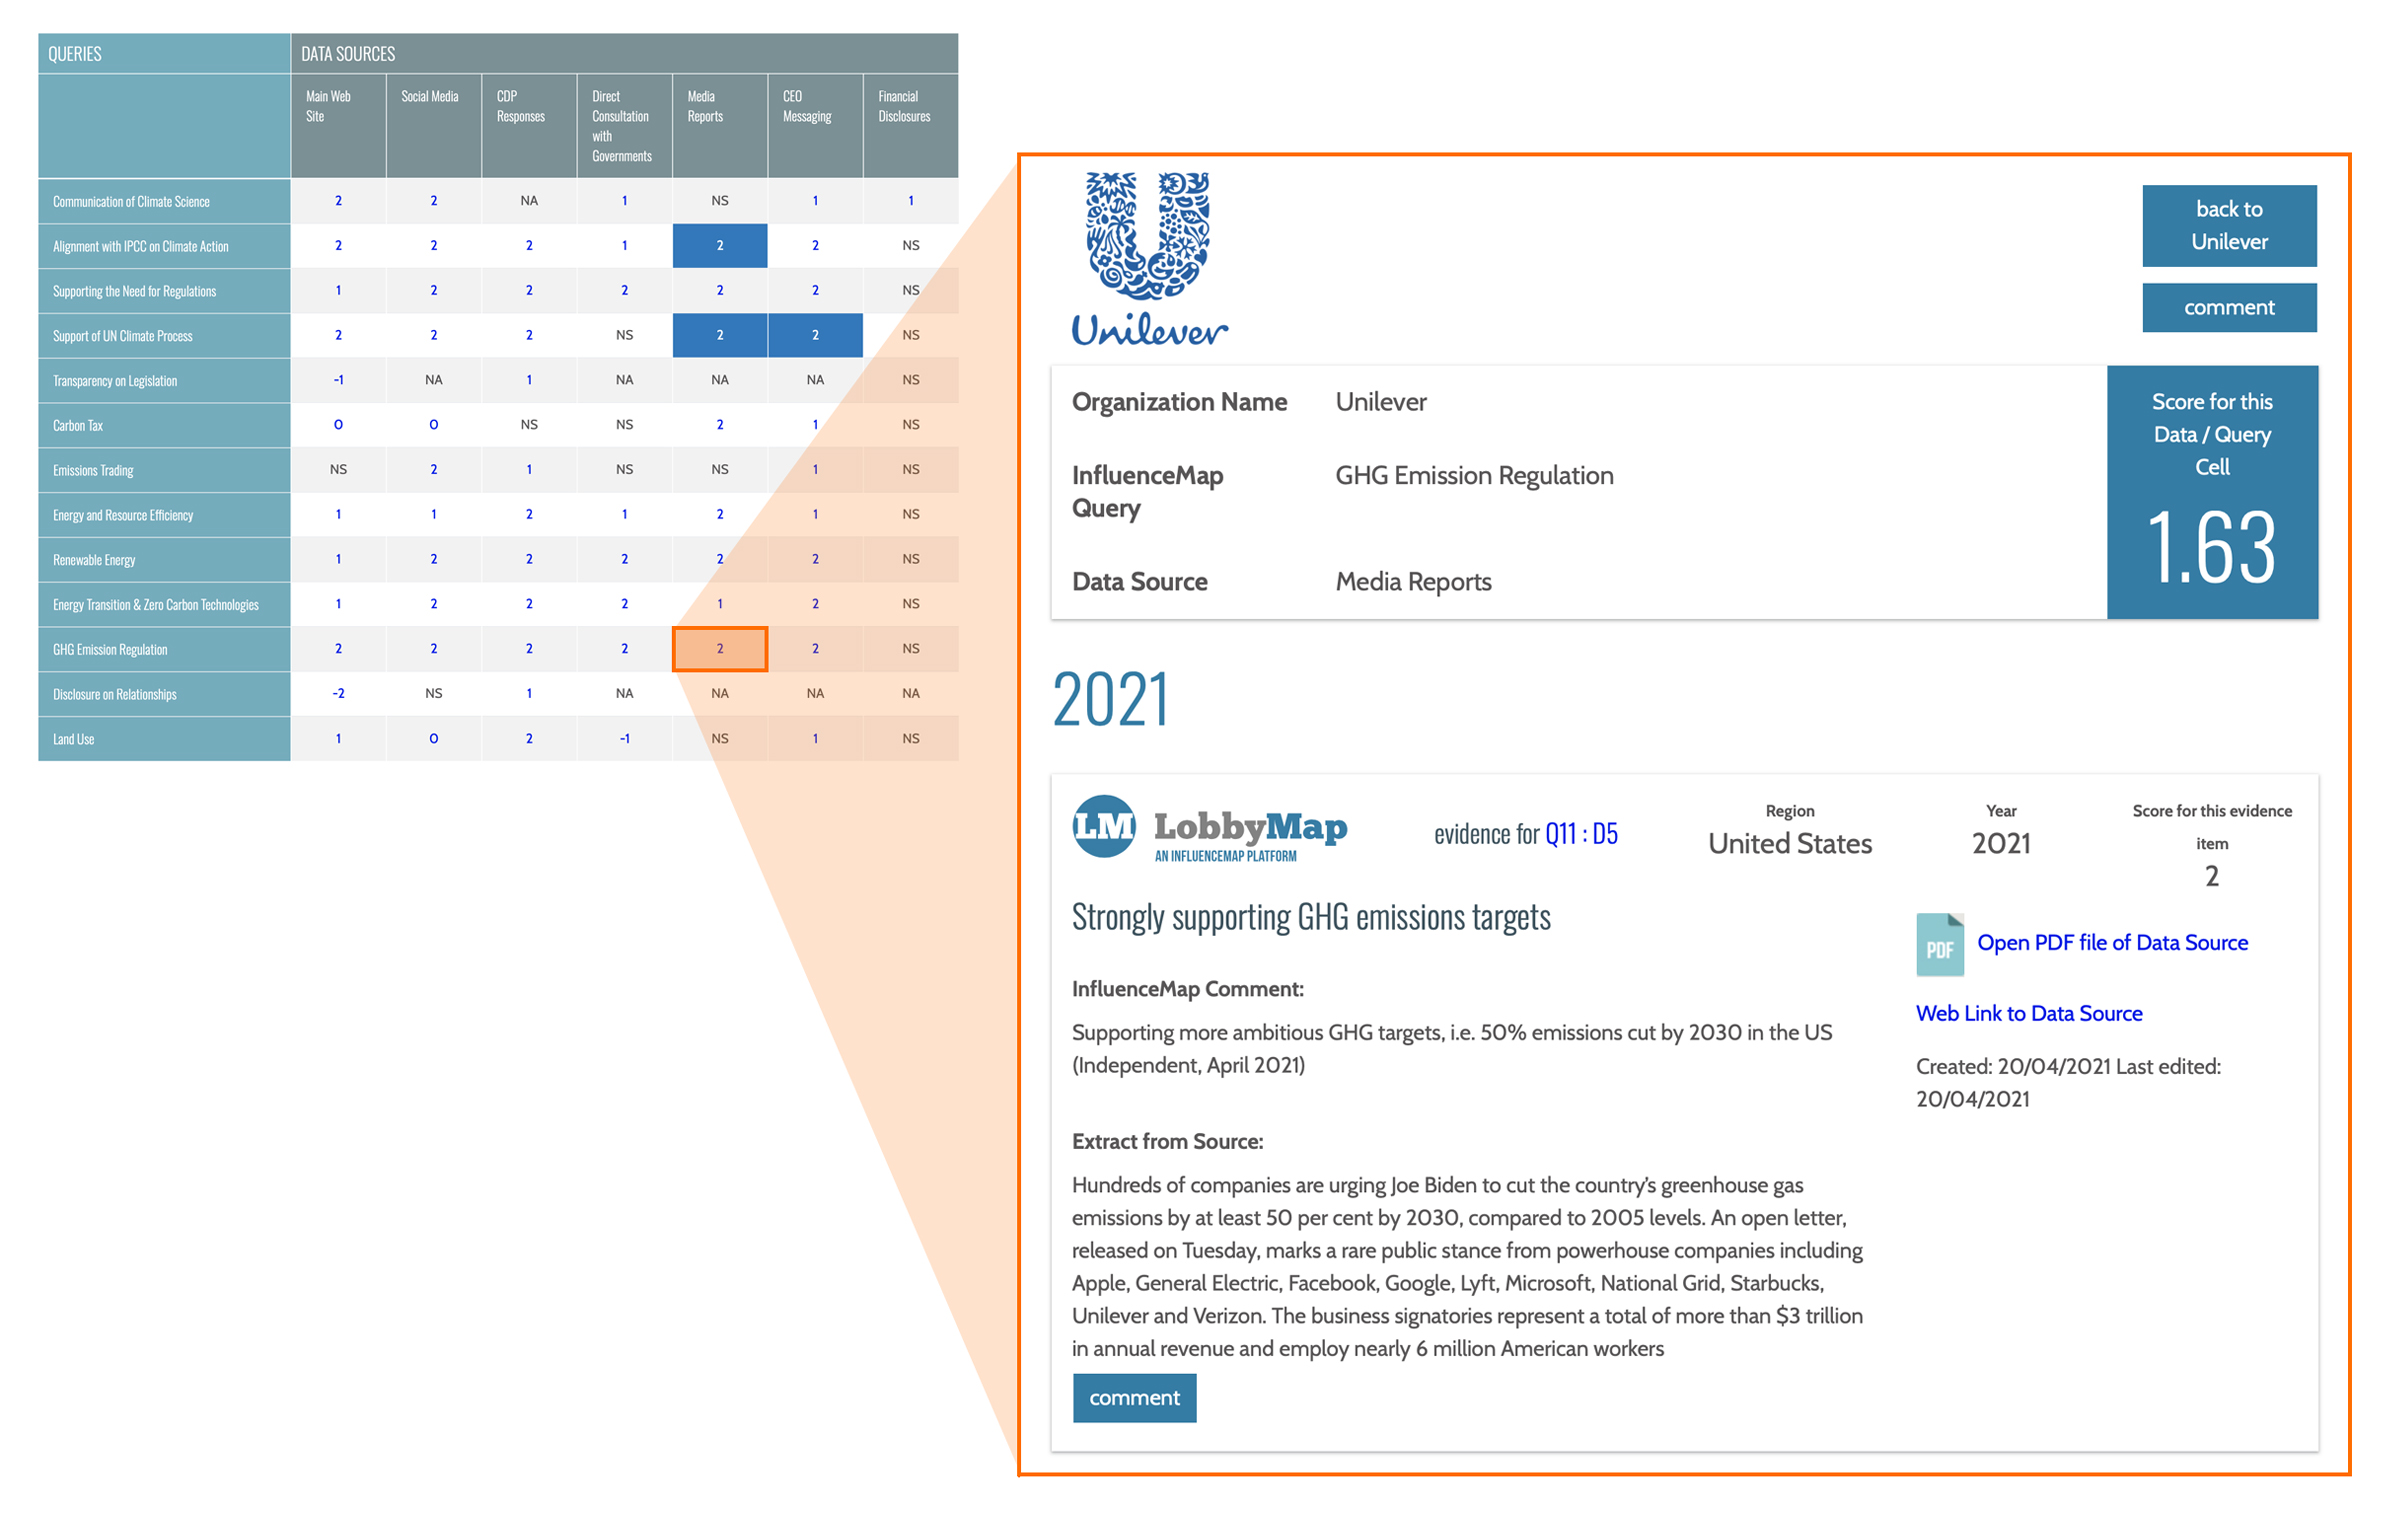
Each cell, representing the intersection of a data source column and a policy query row in the matrix structure, contains evidence collected on a company’s engagement with that query from that data source. The “Cell Score” is an intermediate metric based on the individual scores of the evidence pieces in the cell, their importance, and their year. Older evidence pieces carry less weight in the system, and so only those from the last three years contribute significantly to the current cell score.
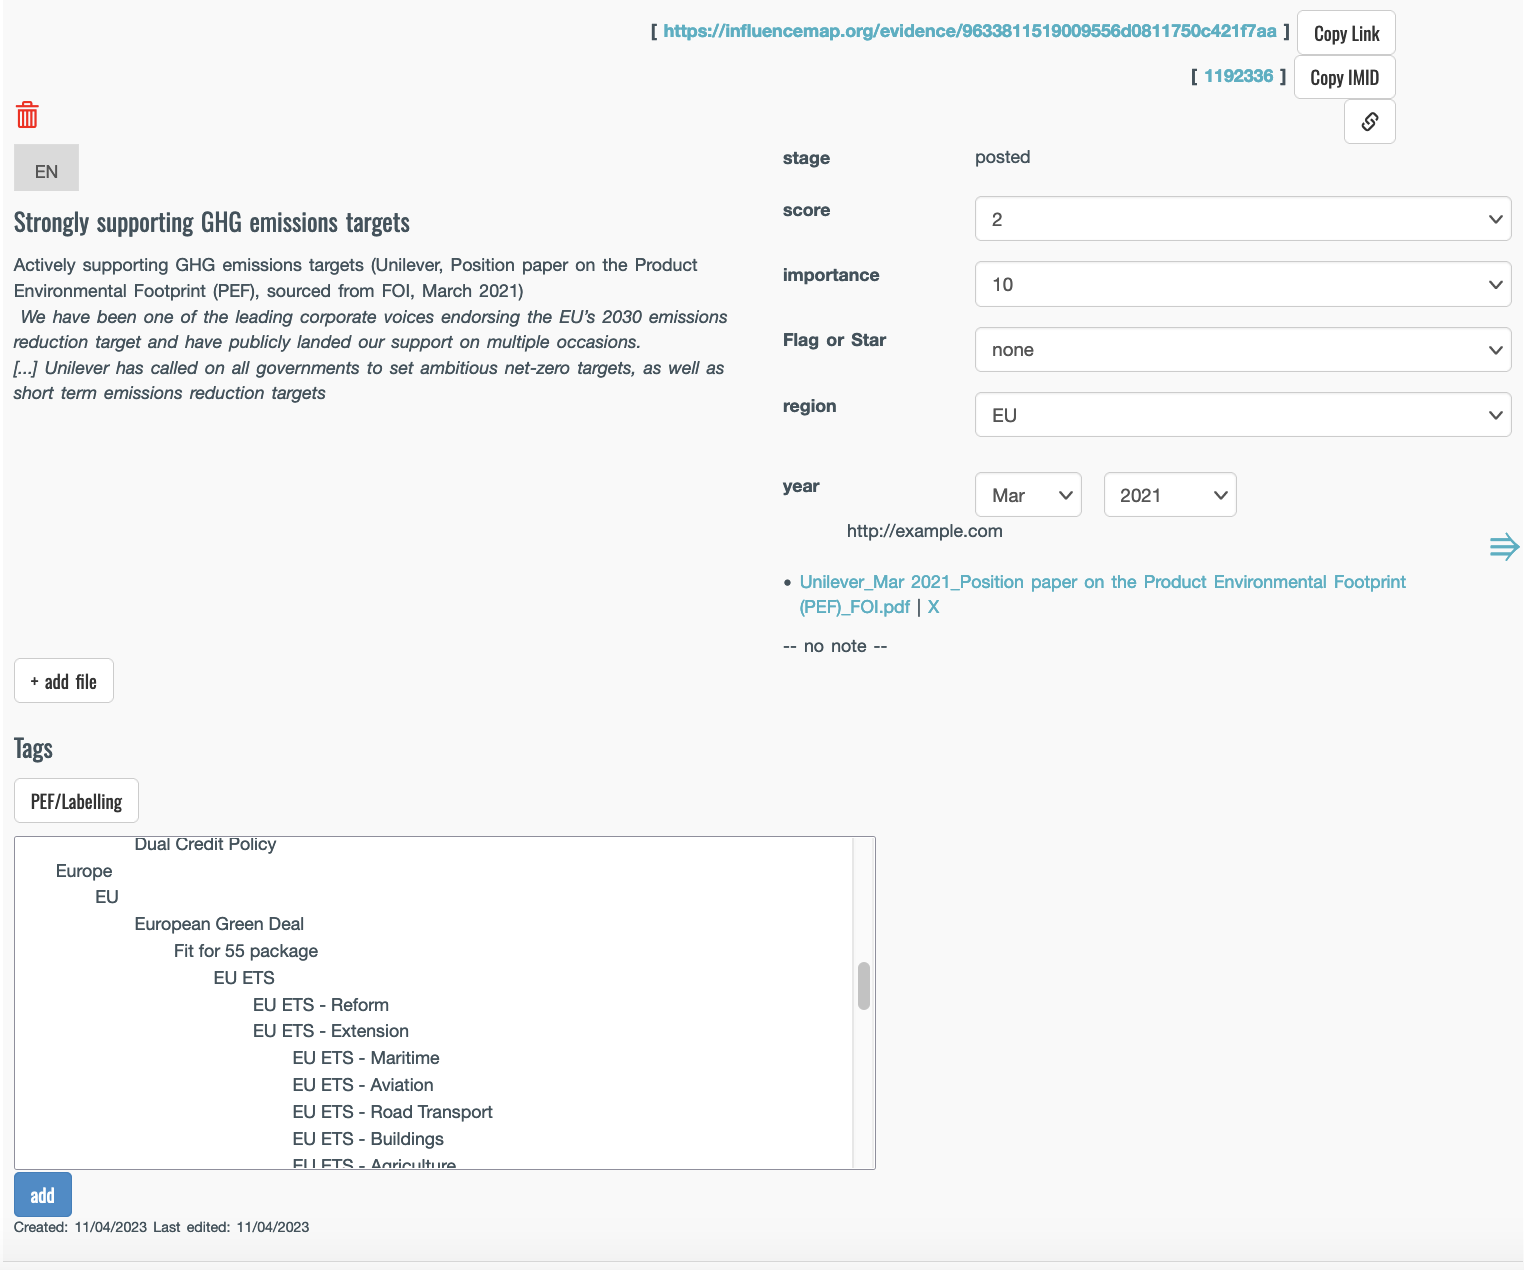
Graphic 5 shows the inside of a cell within the matrix of Unilever's profile. Each cell in the matrix has its own score, which is computed from the evidence contained within it and is weighted for factors such as the date and significance of the evidence. Public users may view this cell by clicking on the relevant matrix cell online.
The terms NS and NA refer to "Not Scored" and "Not Applicable," respectively. Not Scored is given when no evidence is found for that cell. Not Applicable is given when certain data sources do not apply, such as when industry groups do not disclose to CDP or financial regulators.
Web links to the evidence source are provided in the bottom left of the screen, as well as time-stamped downloaded PDF files in case the page has been removed. "Extract from Source" gives an exact quote from the document that InfluenceMap is scoring, while “InfluenceMap Comment” gives a human-generated comment above it.
The range of tags and "intermediate metrics" (metrics used by InfluenceMap to calculate the entity’s final top-line metrics) can be seen by switching to the operator CMS screen view of this same matrix cell.
InfluenceMap’s data-content management system calculates each entity's Organization Score from the scored evidence within each cell, with weightings to factor in the relative importance of the different data sources and queries.
Across the data sources, regulatory consultations (D4) and management messaging (D6) carry the highest weight. Across the queries, higher weightings are applied to policy-specific queries (Q5-Q9) than high-level statements (Q1-Q4). This system also allows for sector variation. For example, the automotive sector will have a stronger weighting assigned to Q11 (GHG Emissions Standards) as this category includes vehicle emissions standards.
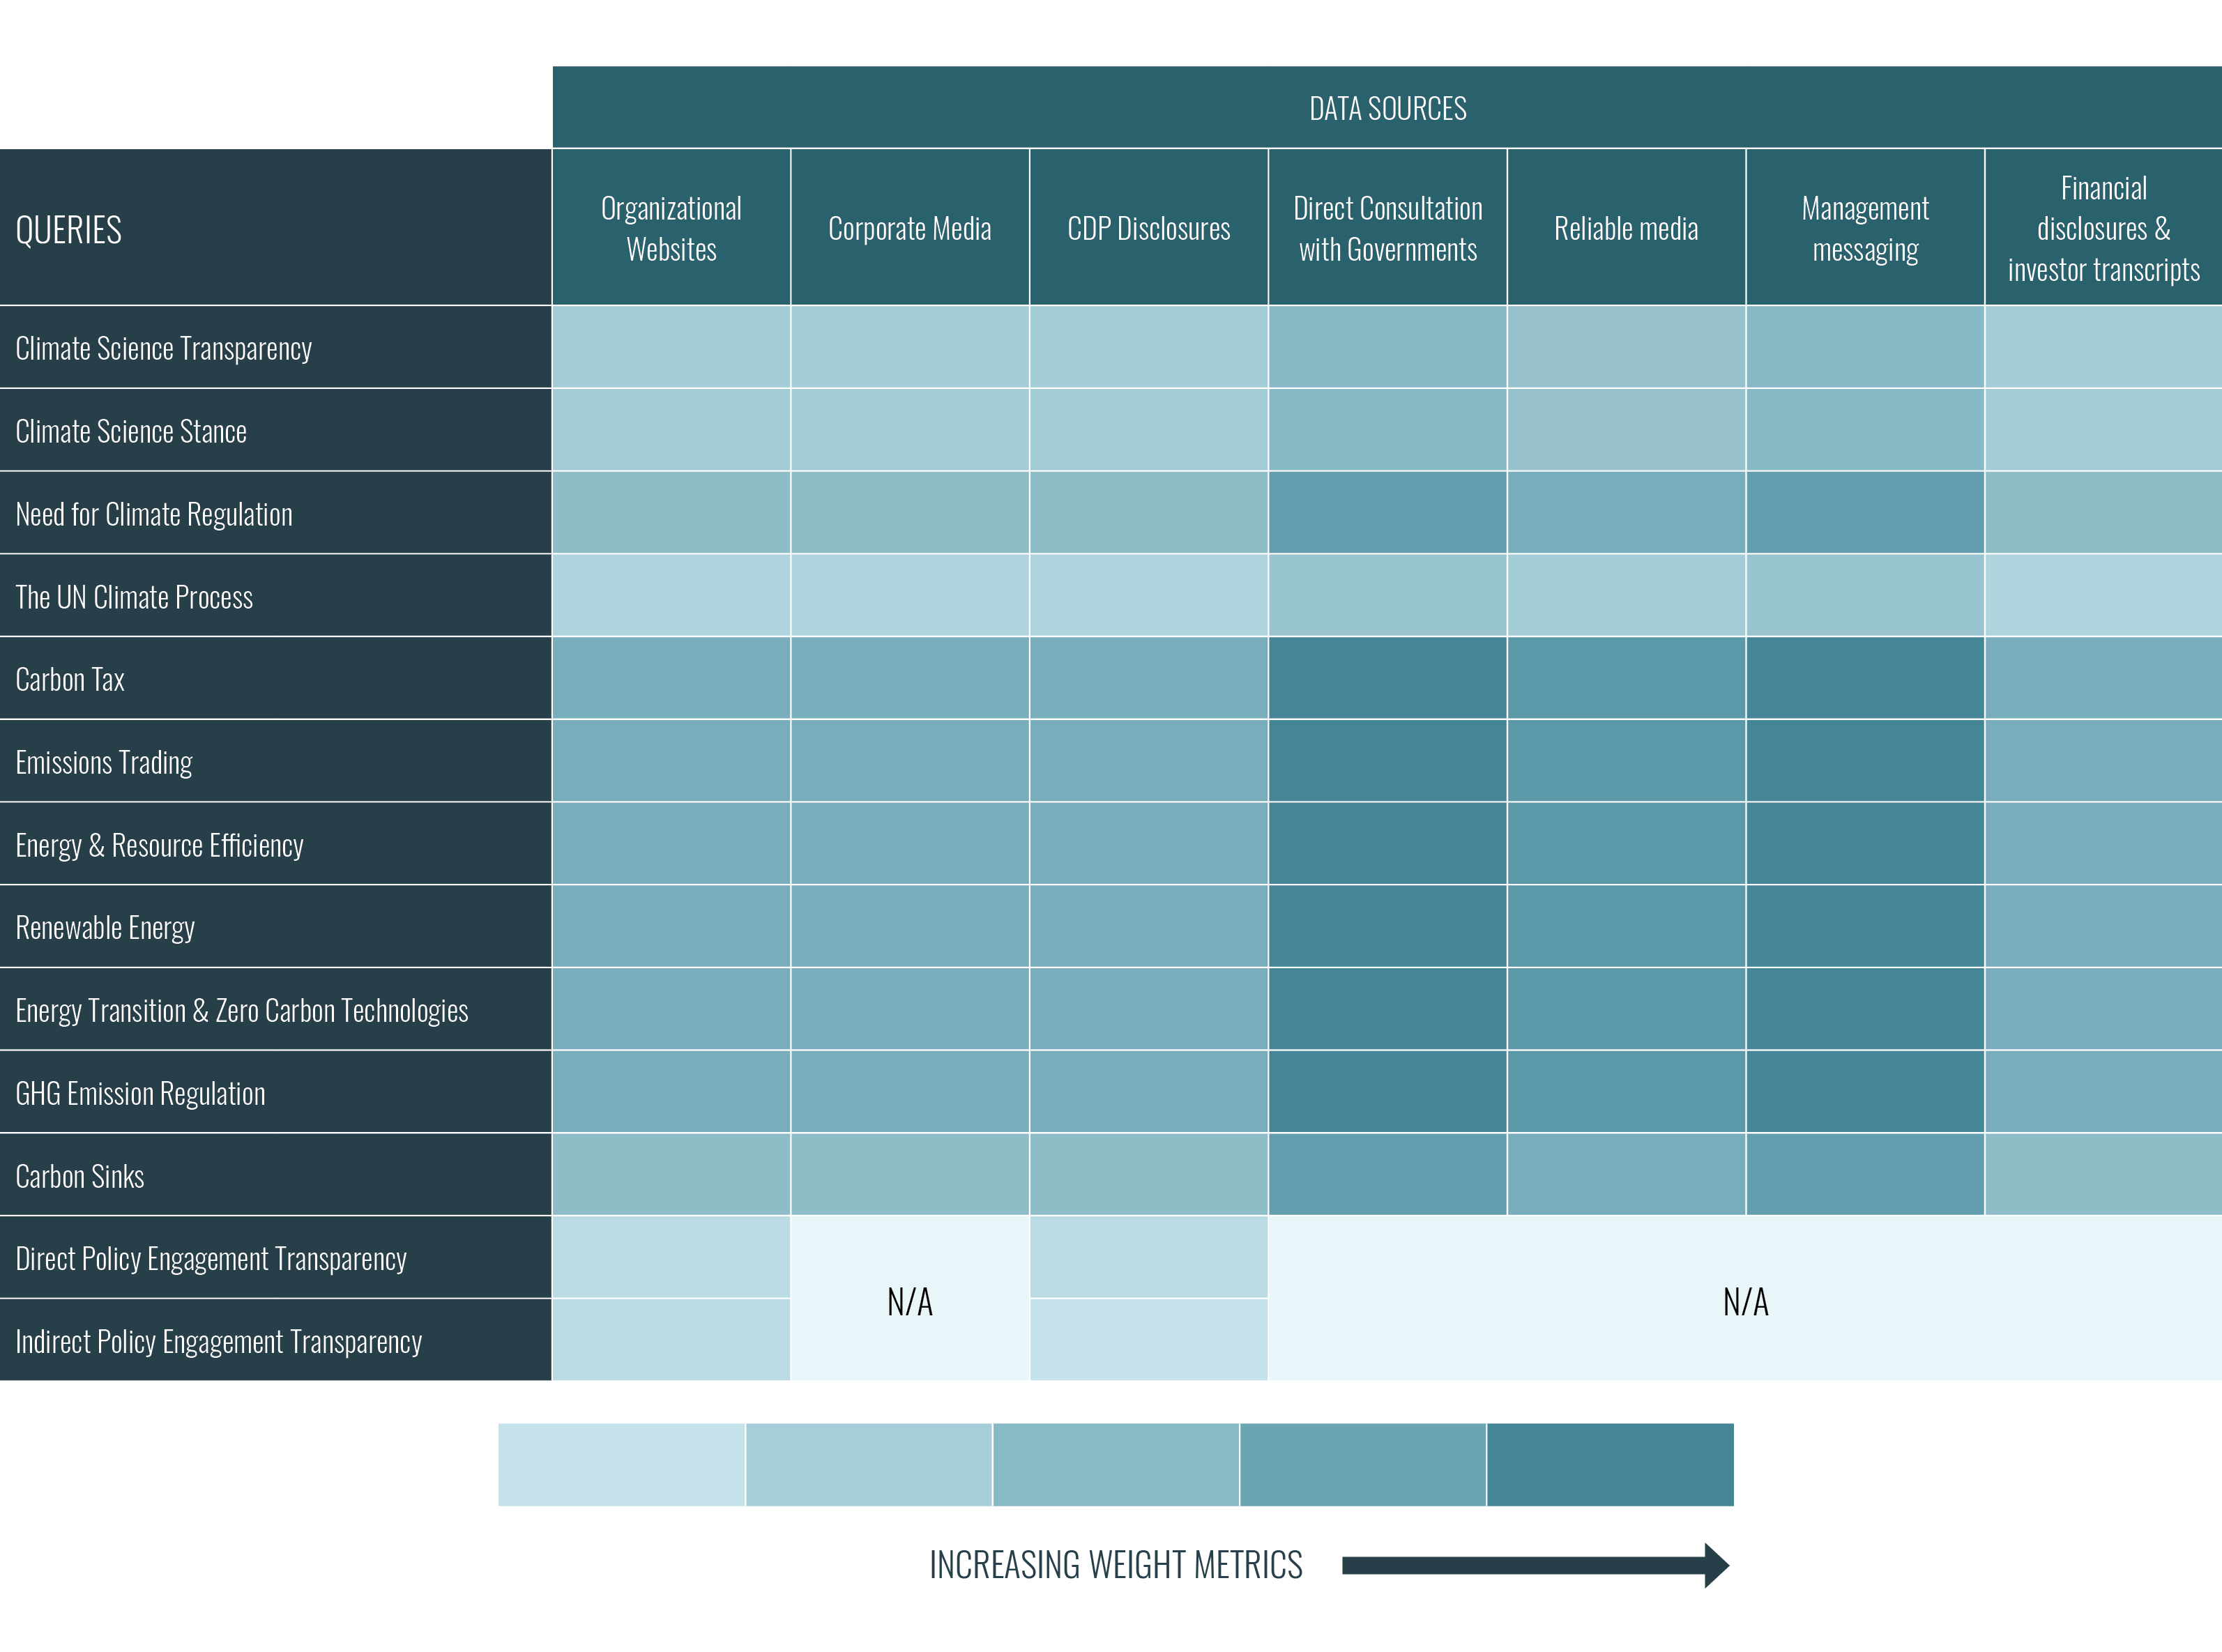
Graphic 7 shows an example of weights applied to the matrix. Query and data source weights result in cell-specific weights, which are demonstrated by shading—deeper shades of blue indicate that the cell is weighted more highly in the overall calculations.
When "Not Scored" (N/S) or "Not Applicable" (N/A) are applied to a cell, the algorithm redistributes the weighting for that cell equally among the remaining cells in that query. The weightings thus always total to 100%, and the lack of information or non-relevance of the data source has no net impact on the organization's top-line metrics.
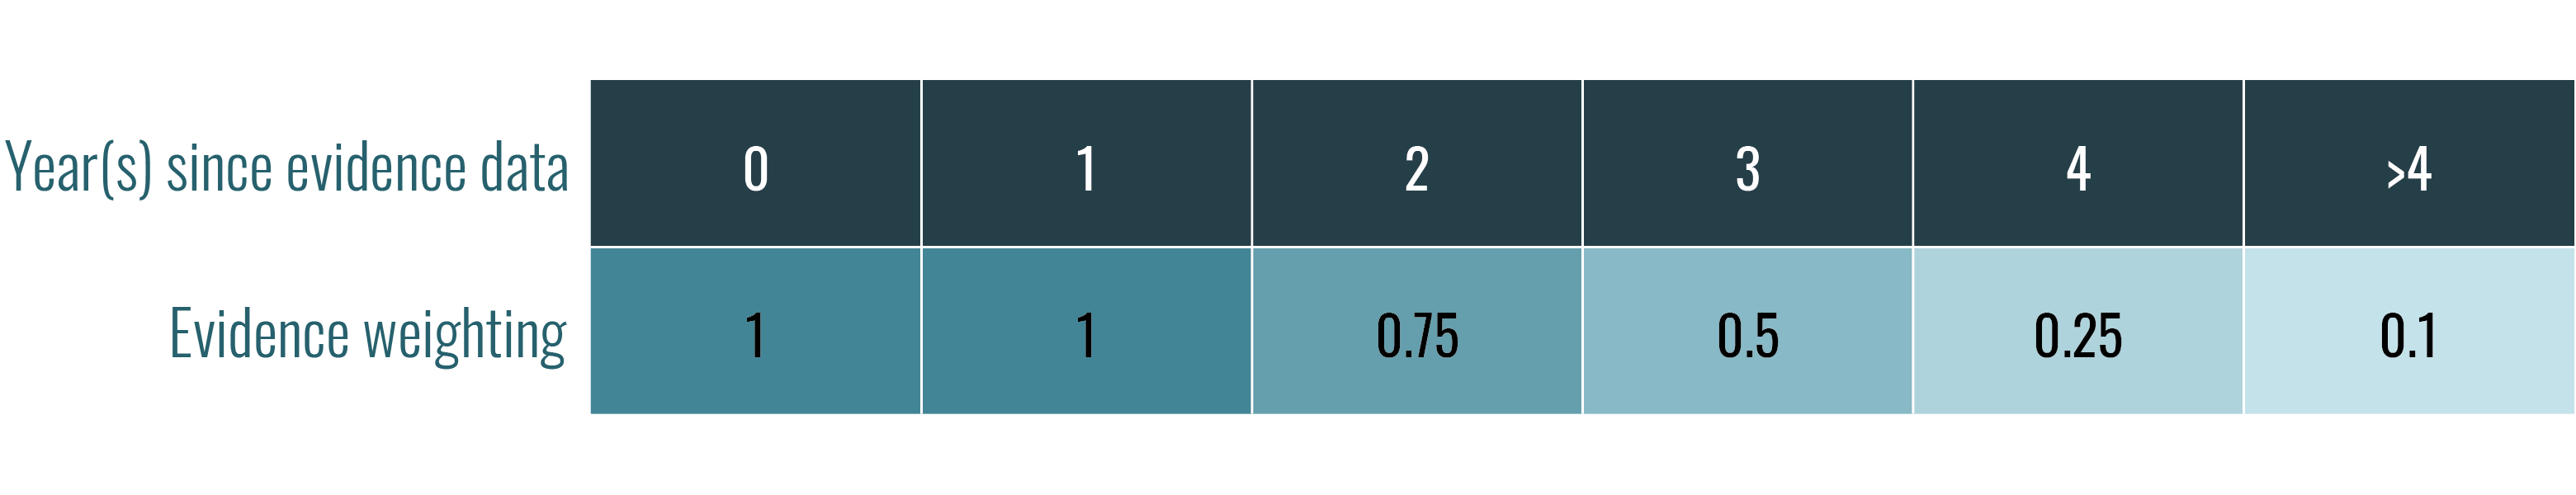
Evidence is collected up to five years before the date of the assessment, with the most recent evidence carrying the most weight. Cells that contain no evidence that is more recent than five years are automatically excluded from the overall calculations.
Separately and additionally to the benchmarking process that determines the alignment of an organization’s climate policy engagement with science-based pathways for delivering the Paris Agreement’s goals, the assessment process seeks to determine the level or intensity of a company’s policy engagement activities. This can be considered a “neutral” measurement as it is not impacted by whether the engagement is supportive or oppositional to climate policy.
Engagement intensity is assessed as follows:
InfluenceMap maintains a database of over 300 industry associations, federations, and advocacy groups (collectively referred to as "influencers'' in the LobbyMap system).
The core role of many industry associations is to represent the interests of their corporate members to governments, with a particular emphasis on processes associated with the formation of policy and regulation.
Industry groups organize themselves in numerous ways, but common groupings include by sector (for example, an automotive or steel sector association), by region (for example, a cross-sector business federation such as the US Chamber of Commerce representing the business voice in that region), or by cross-cutting issue (for example, such issues might include climate change or energy intensive industries).
Industry associations constitute a critical part of the corporate policy engagement landscape. InfluenceMap’s analysis has consistently found them to play active and impactful roles in influencing climate policy. Key contributing factors to their role include:
As such, industry associations are widely used by companies to significantly augment their policy influence in key markets on a range of issues.
The LobbyMap platform’s measurement of a company’s “indirect” influence on climate policy via its industry associations is based on two research processes:
Relationship Strength is assessed on a scale of 1–10 (from weak to strong) based on precise guidelines on how to rate the strength of a variety of relationships. This assessment considers a range of factors, including:
In addition to company-industry association relationship strength, InfluenceMap also measures the “Relative Ranking” of an industry group on a 0–10 scale. This metric is an estimation of the power that the association has in its jurisdiction, such as in the US, the EU, Japan, or internationally. This is assessed with reference to the size of the group and the size and importance of the companies or sectors for which it is mandated to speak. This is done by surveying and aggregating the opinions of businesspeople, policymakers, and civil society groups familiar with the jurisdiction and the group’s political influence.
These sub-metrics feed into the calculation of a company’s overall Relationship Score (see Section 2.3), which, in essence, measures its indirect climate policy engagement by aggregating LobbyMap's assessments of the industry associations of which it is a member. This calculation is moderated by the strength of the company’s relationship to each industry association and the relative importance of each association.
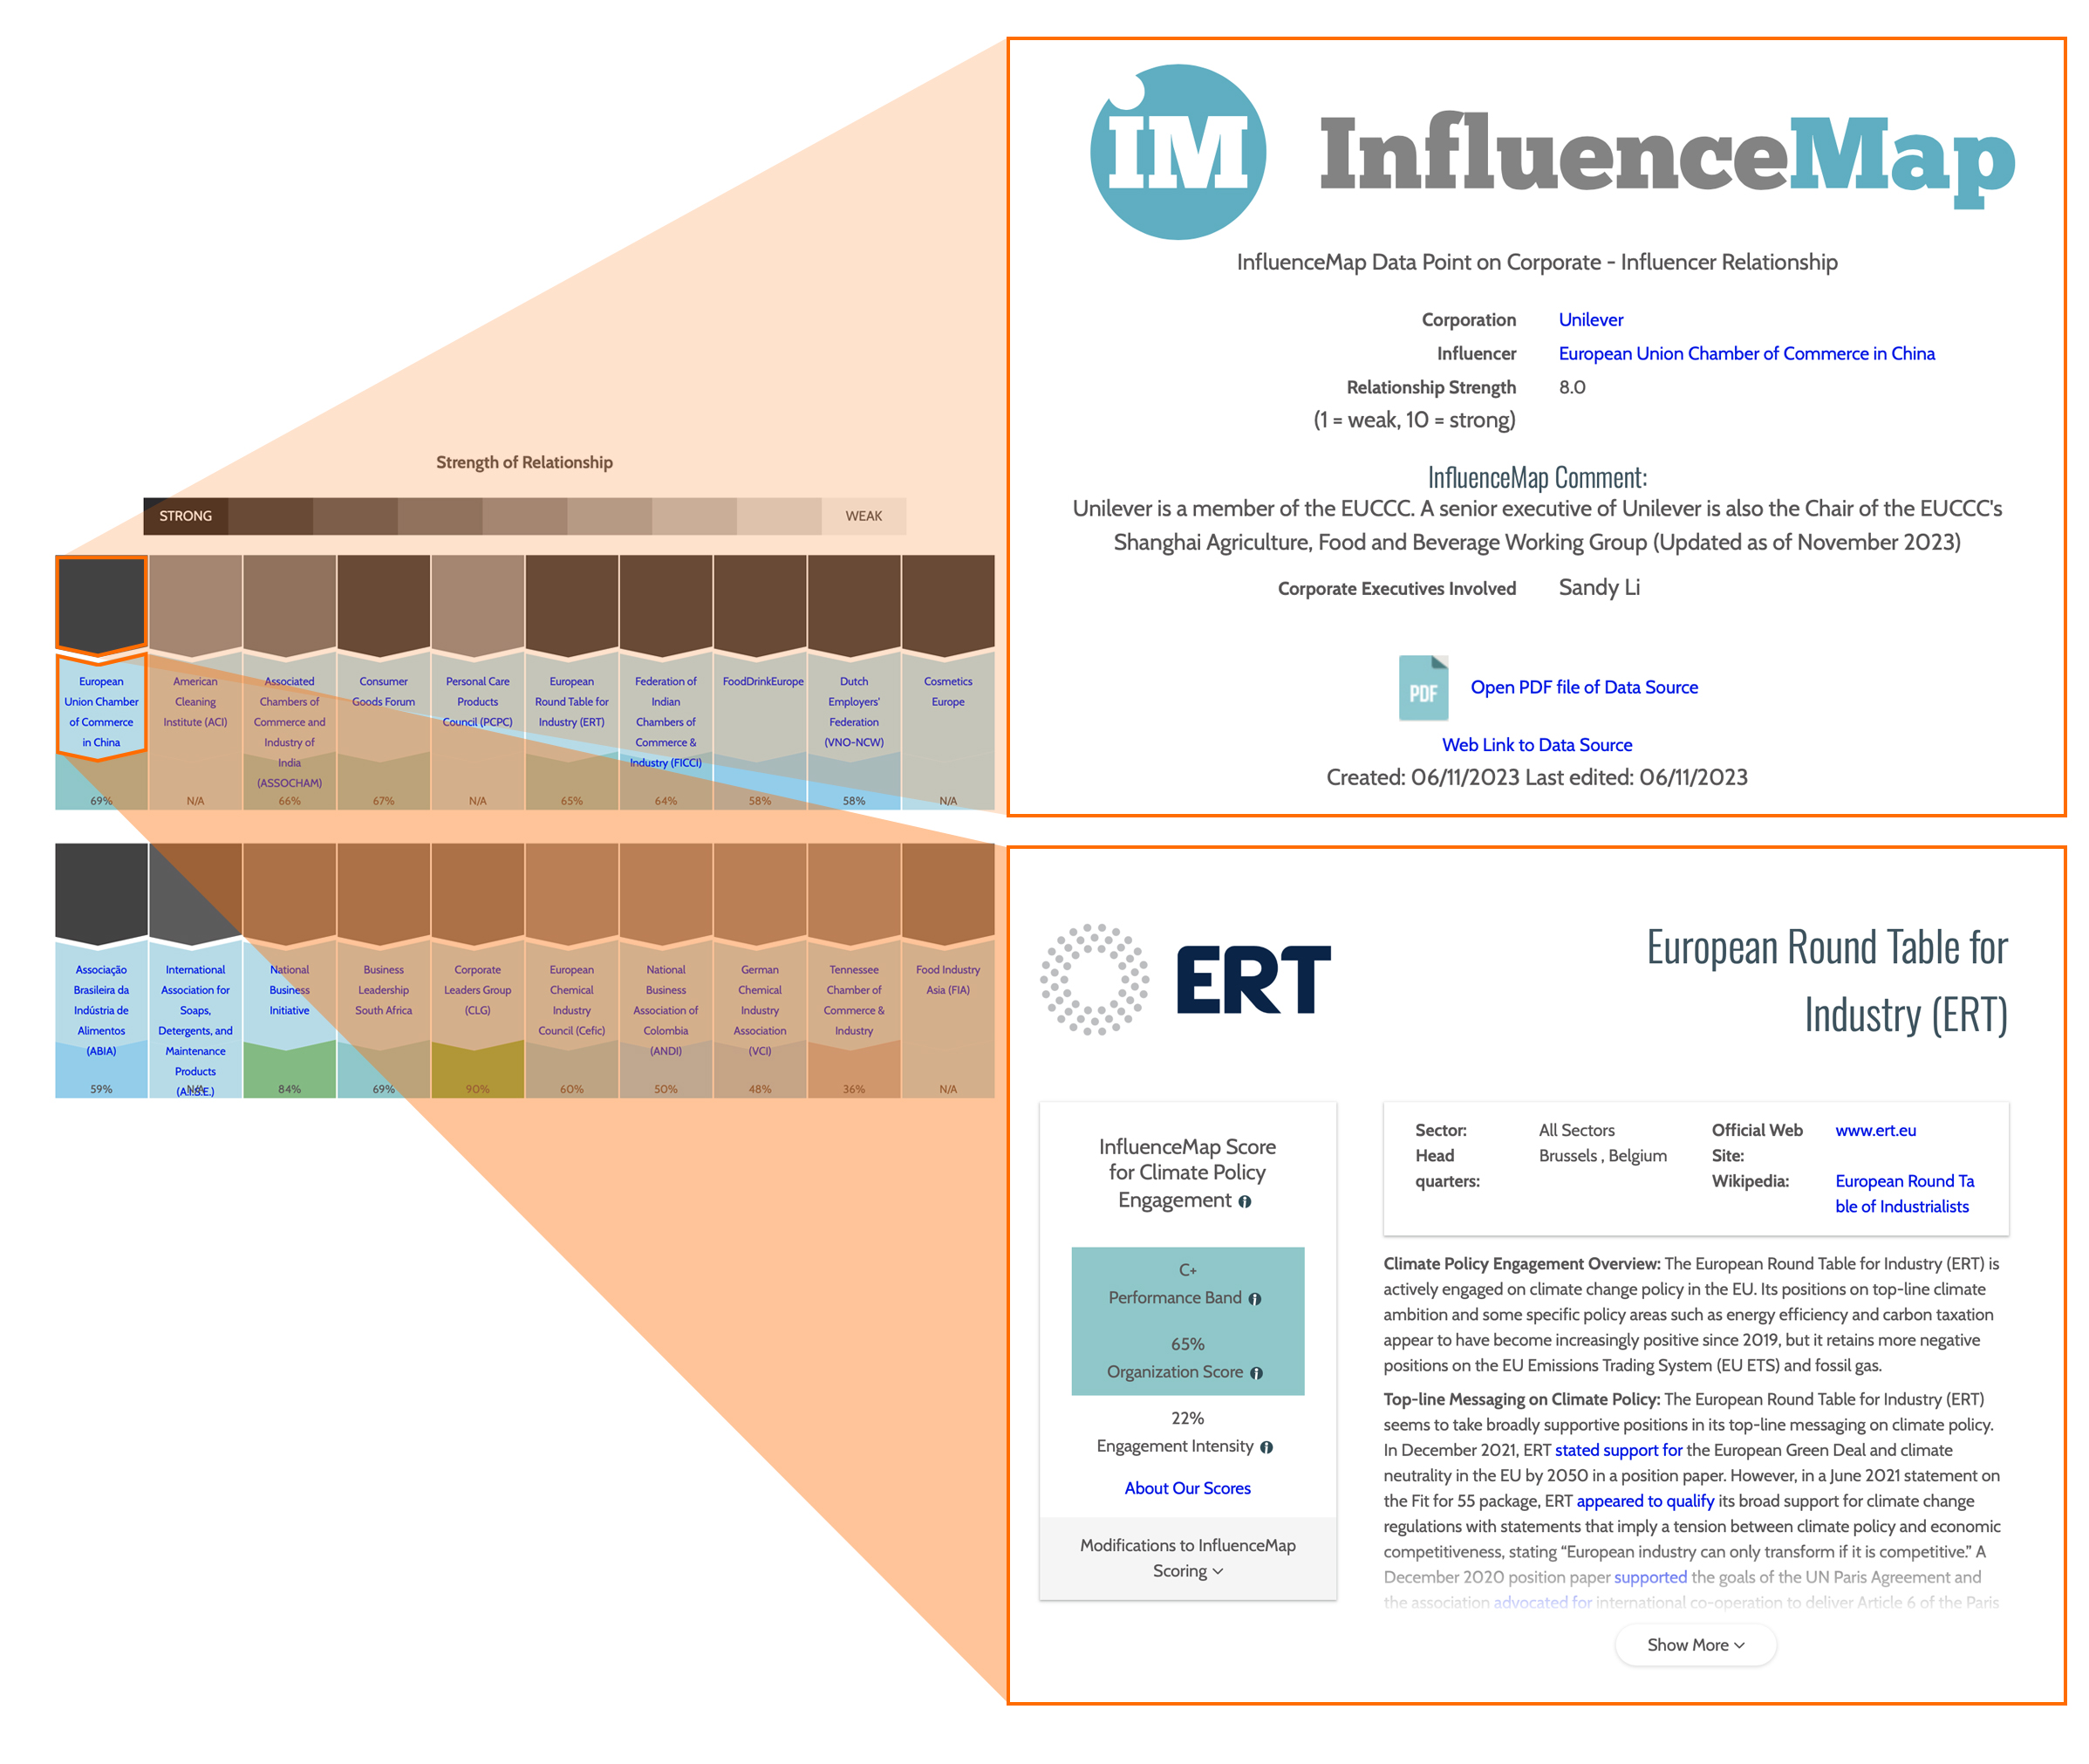
The figure below shows an output of the database of relationships between companies and their key industry groups. InfluenceMap updates this database on a continuous basis.
Graphic 9 shows a snapshot of a company profile, with the "Details of Relationship Score" tab selected. To ensure complete transparency, the Relationship Strength assessments for all links that a company has with its industry groups are available for users to view via a simple light box display over the profile page, as indicated in Graphic 9. Selecting an industry association directly from the Details of Relationship Score selecting tab (as indicated in Figure 9) takes the user to that industry association's LobbyMap profile.
As outlined so far in this methodology, the core of the LobbyMap platform is a research process for tracking and assessing the climate policy engagement of a global universe of companies and industry associations. This analysis is refreshed weekly and affords a range of data-driven insights on the global climate policy and policy influencing landscape.
InfluenceMap recognizes that different users have varying needs (for example, in terms of levels of detail required). The resulting system is designed to meet a variety of user needs in a single, interconnected platform. The main outputs and content described below make up the LobbyMap platform's external facing interface. The links provided take users directly to the relevant part of InfluenceMap's website where the difference aspects of the LobbyMap platform can be explored.
| Output Name | Output Focus | Explanation | Links |
|---|---|---|---|
| Policy Engagement Profiles | The alignment of the entity’s real-world climate policy engagement positions and activities with science-aligned policy pathways for delivering the 1.5°C goal of the Paris Agreement. | The core of the LobbyMap platform is a database of over 1000 company and 330 industry association policy engagement profiles. Each profile comes with a set of core metrics, overviewed in Section 2, covering both direct and indirect (via industry associations) climate policy engagement assessments. This assessment is generated by applying the methodology and system described above in Sections 3 and 4. | Access to LobbyMap company and industry association profiles |
| Disclosure Scorecards | The accuracy of a company’s direct disclosures on climate policy engagement, as well as the robustness of its policy engagement review and misalignment management processes. | Responding to a key ask from the investor community, InfluenceMap provides additional assessments of corporate climate policy engagement disclosures and governance practices against the Global Standard on Responsible Climate Lobbying. The accuracy and robustness of company reporting processes are determined by comparing the company’s direct disclosures against their full LobbyMap profiles (described above). | A full explanation of these assessments, alongside all Corporate Disclosure Scorcards produced to date. |
| Regional Platforms and Policy Trackers | The regional corporate climate policy engagement landscape and real-time developments on key climate policies. | LobbyMap’s tracking and analysis of company and industry association engagement on climate change policy is updated on a weekly basis, offering a near real-time data feed on how industry is seeking to influence key policy and regulations as they evolve. InfluenceMap’s Policy Trackers enable users to explore how the corporate sector is engaging with specific policies and regulations, providing unique insights on corporate influence over climate policy developments in real time. | Access to the LobbyMap regional platforms and policy trackers. |
| Reports, Briefings, and Newsletters | Key trends and emerging issues identified from ongoing LobbyMap research. | InfluenceMap produces regular reports, briefings, and newsletters to showcase important trends and highlight issues detected in LobbyMap’s ongoing research. Such outputs might take a deeper look at policy engagement by a specific sector, within a specific region, or on a specific policy. | Access a list of our latest LobbyMap reports and briefings. |
Section 4 (The Assessment Process and Scoring Benchmarks) of the methodology explained the logic behind the science-based policy benchmarks that the LobbyMap platform utilizes to assess corporate climate policy engagement. This appendix provides more information on why and how the Intergovernmental Panel on Climate Change’s (IPCC) research is used to develop these benchmarks.
InfluenceMap does not have its own opinion or preference on the roles for various technologies or fuels in the energy transition, but instead refers to the IPCC’s analysis and guidance. As explained in detail below, the science-based policy benchmarks that underpin LobbyMap’s analysis are derived from the IPCC’s consensus-driven findings, resulting from the analysis of hundreds of scenarios able to meet the Paris Agreement’s goals.
The Intergovernmental Panel on Climate Change was established in 1988 by the World Meteorological Organization (WMO) and the United Nations Environment Programme (UNEP) to provide scientific information to help shape the global response to climate change.
The organization consists of 195 member governments and, to ensure the rigor, objectivity, and transparency of its work, operates a system of expert and government reviews. The IPCC’s assessments inform negotiations regarding the United Nations Framework Convention on Climate Change (UNFCCC) and provide a scientific foundation for member states to develop climate-related policies to deliver on their UNFCCC commitments.
The IPCC does not conduct its own research but rather synthesizes the latest scientific findings on climate change. IPCC author teams use a systematic process and clearly defined language to agree on and characterize the degree of certainty in their assessment conclusions. The IPCC describes its assessments as “policy-relevant but not policy- prescriptive”; instead of seeking to “tell policymakers what actions to take,” the IPCC focuses on the impact of different types of response to future projections of climate change.
InfluenceMap utilizes these assessments as the basis of its science-based policy benchmarks, which follow a similar philosophy. InfluenceMap’s assessments do not prescribe exactly what policies companies and industry associations should support. Instead, the assessments measure companies’ and industry associations’ climate policy positions against the IPCC’s guidance on the likely impact of different policy pathways. Following this logic, the highest scoring positions are aligned with actions that the IPCC assesses as having the greatest chance of limiting global temperature rise to as close to 1.5°C as possible.
The IPCC publishes a comprehensive assessment report covering the state of scientific, technical, and socioeconomic knowledge on climate change every six to seven years. The IPCC also produces special reports on specific topics determined by its member governments. A synthesis report, prepared at the end of an assessment cycle, integrates the assessment report and any special reports prepared during this time. Since 2015, the IPCC has published its 6th Assessment Report (AR6), alongside a number of special reports. InfluenceMap’s benchmarking process focuses on the following publications:
Each IPCC assessment report is comprised of three working group contributions: Working Group I (the physical science basis); Working Group II (impacts, adaptation, and vulnerability); and Working Group III (mitigation).
The report from Working Group III (AR6 WGIII) provides an updated assessment of global mitigation progress and assesses the impact of potential measures and policy pathways in relation to the long-term emission and temperature limit goals set by the Paris Agreement. A key finding of this analysis is the centrality of urgent and robust government climate policy action, at all levels of government, to deliver the critical sector transitions needed to address the climate crises. The report also points to the influence and impact of “incumbent industry” as a major blockage to the progress of such policy.
The AR6 WGIII report has 12 chapters, six of which deep dive on different sectors of the economy and include a discussion of the policy mechanisms needed to transition these sectors towards net-zero. Further discussion on necessary government policy is found in several additional chapters that focus on issues like investment and finance, synergies with sustainable development, and national and subnational policies and institutions.
The IPCC has produced three special reports since 2016, of which InfluenceMap refers to the 2018 Special Report on Global Warming of 1.5°C and the 2019 Special Report on Climate Change and Land in its science-based policy benchmarks.
The Special Report on Global Warming of 1.5°C was produced by the IPCC in 2018 following an invitation by UNFCCC during COP21 in 2015. The mandate of the report was to overview a set of potential emissions reduction pathways and systematic transition options that could lead to a transformation of the global energy system in line with the 1.5°C goal. Published in 2018, the report concludes that “robust, stringent and urgent transformative policy interventions” are needed to achieve systematic change, entailing radically different conditions under which companies will have to operate and sell their products. The report provides a framework for understanding 1.5°C-aligned policy positions through its assessment of the role of various energy sources, technologies, and policy options across the different 1.5°C mitigation pathways (Chapter 2). It also includes further discussion of the feasibility of the mitigation options available for energy, transport, and industrial system transformations (Chapter 4).
The 2019 Special Report on Climate Change and Land brought attention to the importance of land use as a highly significant source of greenhouse gas (GHG) emissions. The report estimates that Agriculture, Forestry, and Other Land Use (AFOLU) activities accounted for nearly a quarter (23%) of total net anthropogenic GHG emissions from 2007–2016, breaking down further into 13% of CO², 44% of methane (CH₄), and 81% of nitrous oxide (N²O). The IPCC’s Special Report on Climate Change and Land states that all assessed modeled pathways that limit warming to 1.5°C or well below 2°C will require land-based mitigation and land use change and provides a framework for understanding the best way for delivering these changes.
The IPCC uses scenarios and emission pathways to explore future climate change trajectories and the related effectiveness of different mitigation efforts. A scenario is a description of a possible climate future. An emission pathway is a modeled trajectory of GHG emissions and can make up (the quantitative) part of scenarios. Integrated Assessment Models (IAMs)—a key tool for evaluating the implications of climate action—combine discussion of societal choices and potential paths for human development with an assessment of how these might impact the natural world.
Comparing many different types of scenarios, the IPCC deploys a consensus-driven process for developing its key findings by identifying areas of agreement. These areas of agreement might relate to the likely impact of different types of climate policy or the role of a range of technologies and energy types.
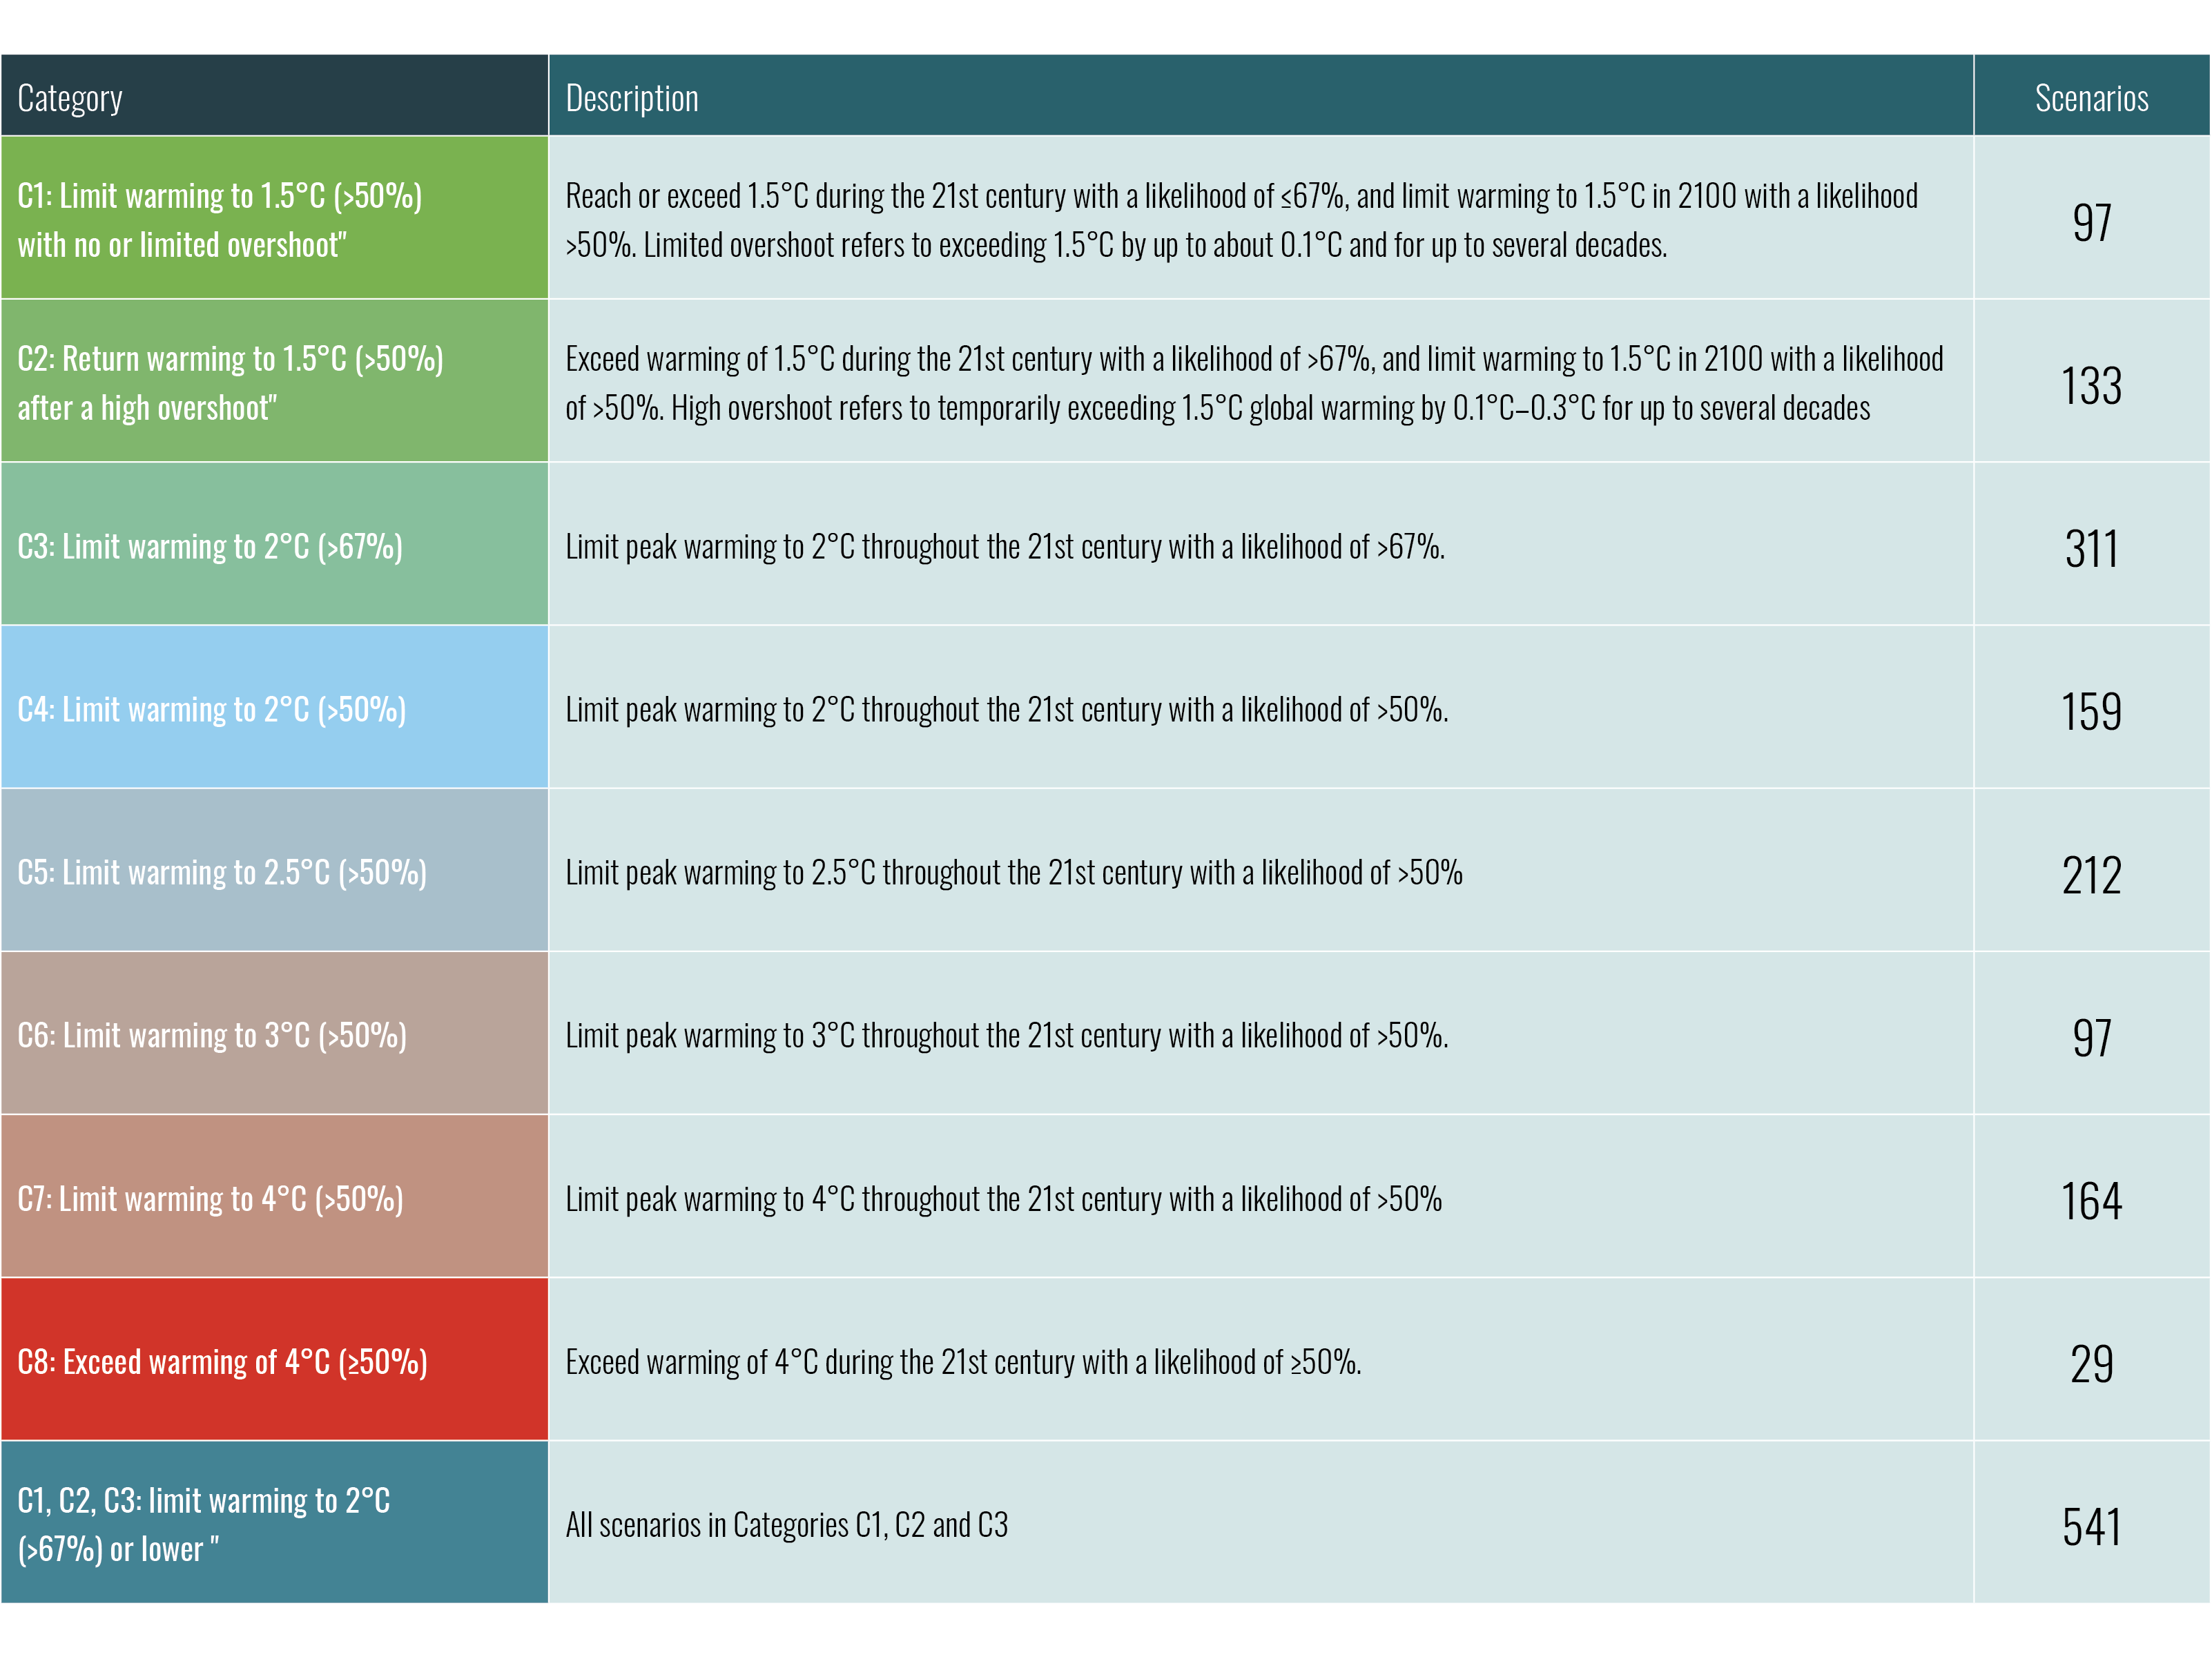
In its 1.5°C Special Report (2018), the IPCC used IAMs to explore the different decarbonization pathways available to stay within a 1.5°C or 2.0°C warming scenario, covering 90 pathways consistent with 1.5°C warming and 132 pathways consistent with 2.0°C warming. The IPCC’s 2022 AR6 WG3 report analyzed over 1500 scenarios in the process of producing its findings. Each scenario was assigned a temperature classification based on the likely outcome achieved. These range from scenarios able to limit warming to 1.5°C with limited overshoot to 2°C scenarios to scenarios that exceed warming of 4°C.
Following a process of selecting findings that relate to areas of agreement among scenarios that achieve Paris-aligned temperature goals, the IPCC’s research provides a framework to understand which policy decisions and technology pathways align with these goals.
The IPCC’s analysis covers not only the hypothetical climate contribution of different energy types, technologies, and policy pathways, but also includes analysis of the technical, political, and economic feasibility challenges associated with these options. InfluenceMap draws on both aspects of this analysis to draw up its science-based policy benchmarks.
The IPCC is an international organization and, to ensure high standards of transparency, accountability, and agreement regarding its research, has a careful and democratic system of reviews on each of its outputs. This process incorporates input from expert reviews and governments during the drafting process. The final draft is distributed to governments for a final round of written comments before being approved in government-attended plenary sessions.
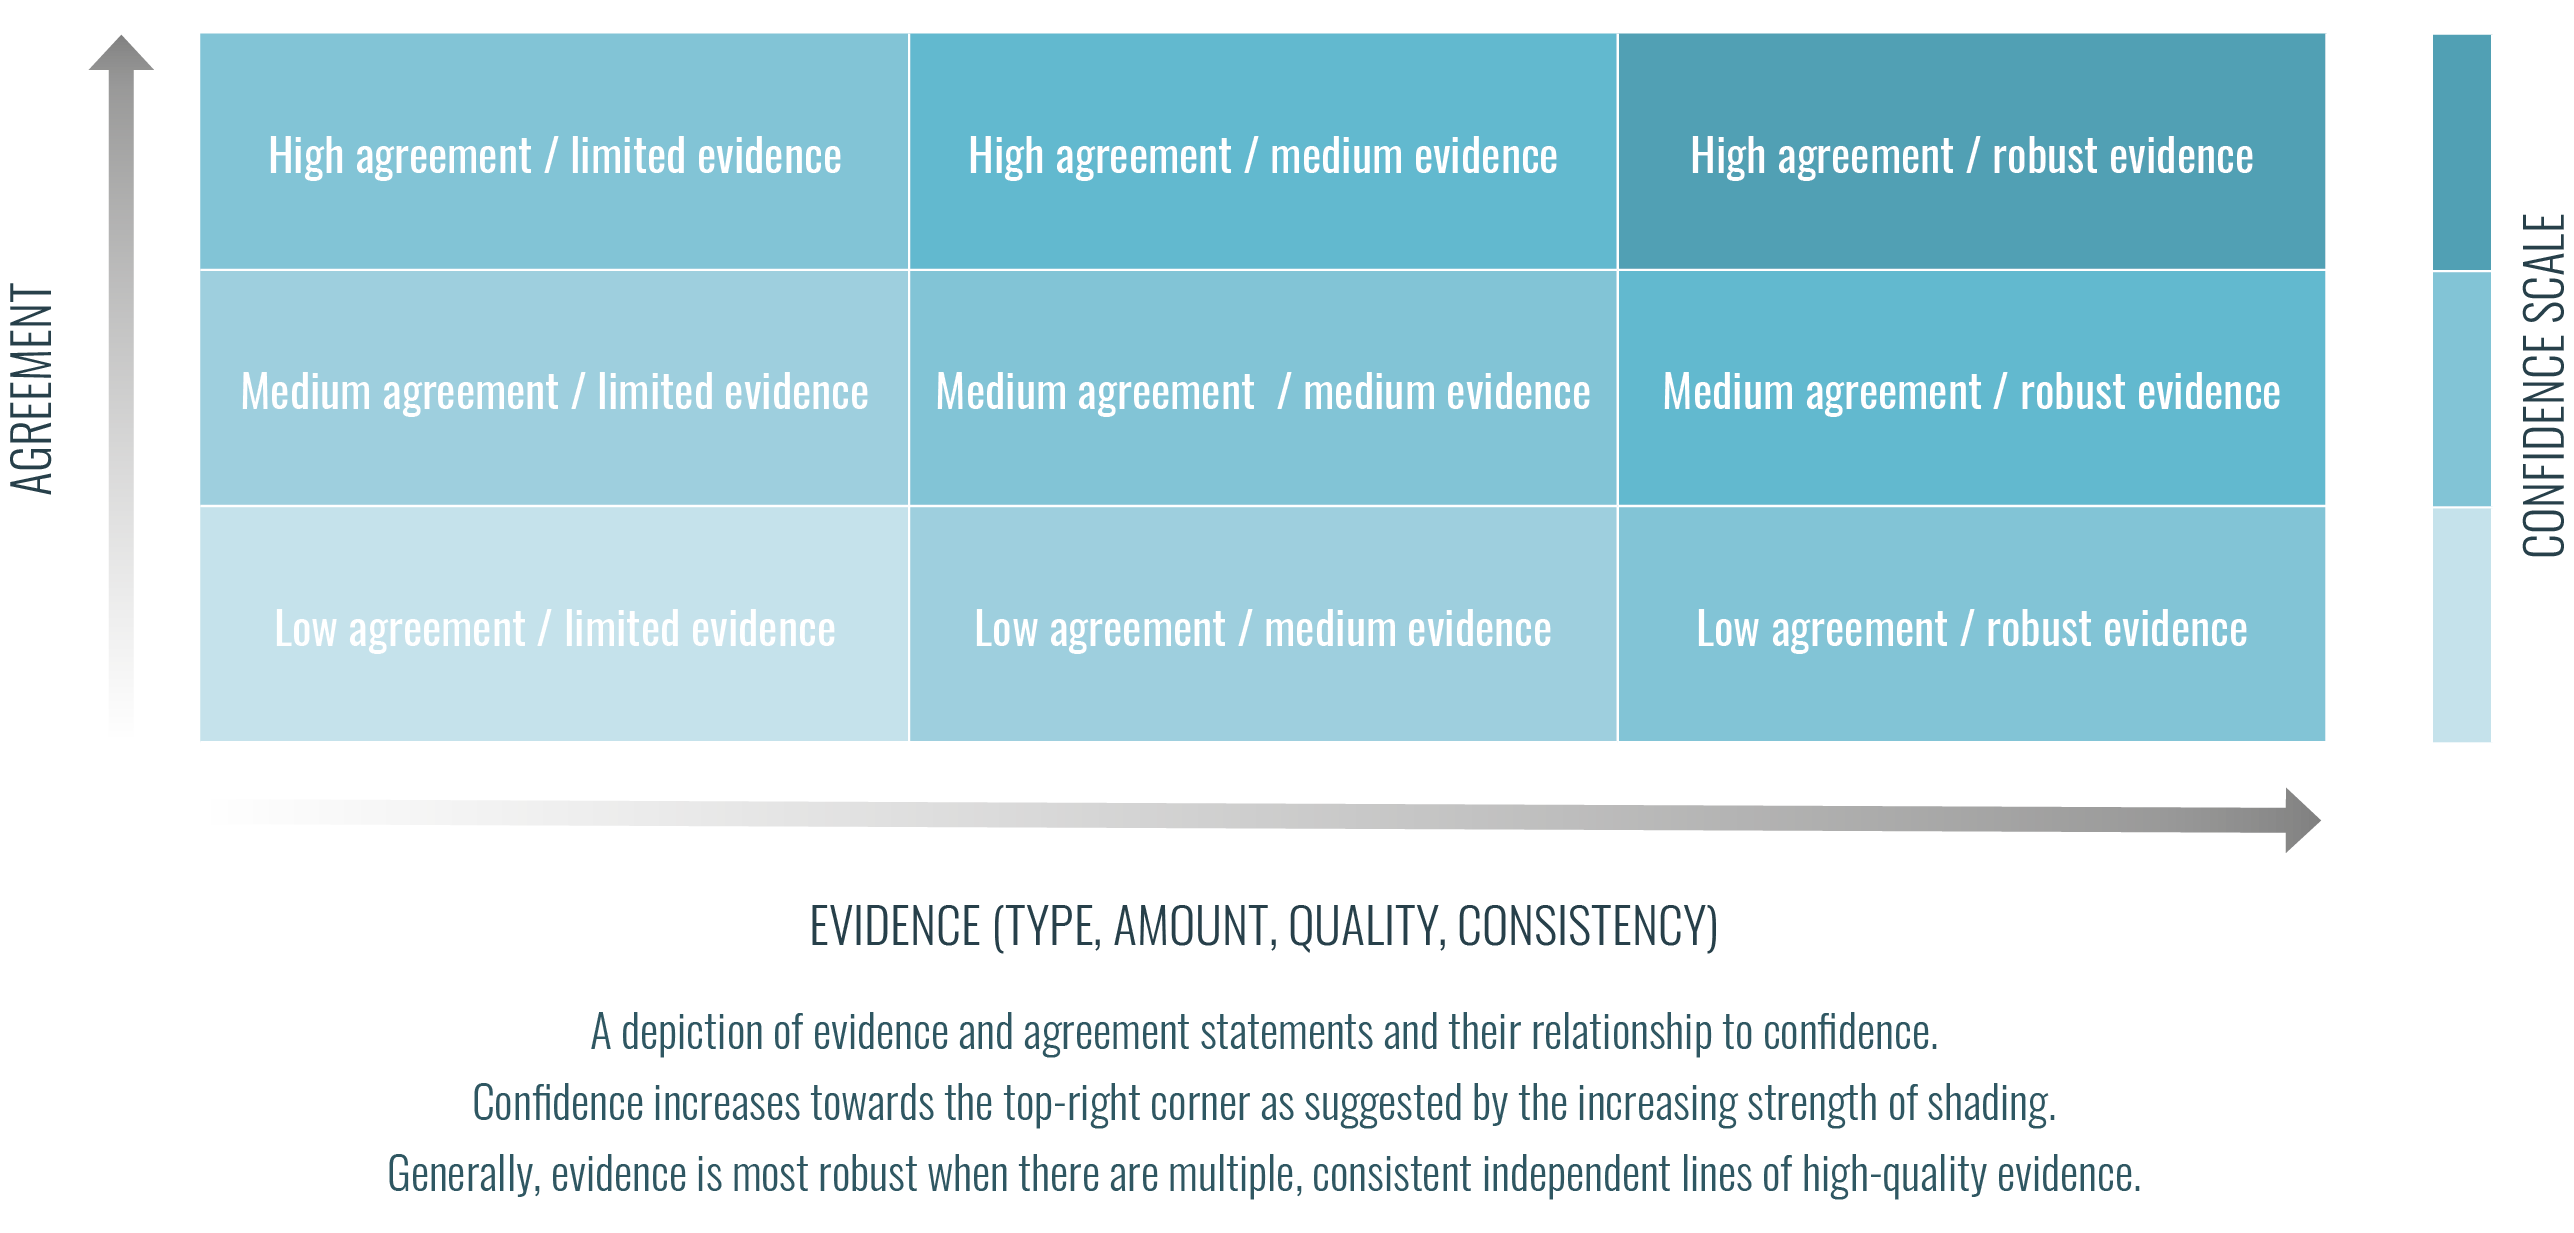
Rather than conduct its own analysis, the IPCC critically assesses the available academic literature for understanding climate change. IPCC author teams evaluate each source before its inclusion in their research. A careful system is used to express the level of confidence in each finding. According to the IPCC, this system helps define “a common approach and calibrated language that can be used broadly for developing expert judgments and for evaluating and communicating the degree of certainty in findings of the assessment process.”
When assessing certainty, IPCC authors consider two key dynamics:
“Confidence in the validity of a finding (expressed qualitatively), based on the type, amount, quality, and consistency of evidence (e.g., mechanistic understanding, theory, data, models, expert judgment) and the degree of agreement.”
“Quantified measures of uncertainty in a finding expressed probabilistically (based on statistical analysis of observations or model results, or expert judgment).”
Rather than assess the advocacy and policy positions of companies and industry associations against particular IPCC scenarios or pathways, InfluenceMap draws on the IPCC's consensus-driven findings, resulting from the analysis of many 1.5°C compatible pathways, as the basis for its science-based policy benchmarks.
InfluenceMap’s process for deriving scoring benchmarks from the IPCC reporting relies on the following principles:
Findings that align with meeting the goals of limiting global temperature to the Paris Agreement’s goals of “well below 2°C and towards 1.5°C.” As part of this approach, findings that are aligned with the greatest amount of mitigation (i.e., achieving 1.5°C with limited or no overshoot) are given preference, followed by findings that achieve Paris-aligned temperature limits but with less ambition or urgency.
Policy guidance statements from the IPCC report that, where possible, are associated with the greatest confidence and backed by the most evidence are relied on the most. Such findings are generally found in report chapter executive summaries, as well as each report’s Summary for Policymakers. Further findings discussed in detail throughout the IPCC’s reporting are used to guide LobbyMap’s scoring framework where greater nuance is required.
Corporate and industry group alignment with the science-based policy benchmarks is analyzed with consideration given to the specificity of the positions communicated by these entities. Evidence that demonstrates active and detailed engagement on a particular climate policy issue is likely to be considered to have a greater degree of alignment (or misalignment) with a given science-based policy benchmark than evidence consisting of passive or general statements.
InfluenceMap uses an altered set of queries for finance sector companies and industry associations to incorporate an analysis of both climate-related financial policy and real-economy climate policy. All other aspects of the methodology remain the same.
Climate finance queries were drawn from the United Nations Environment Programme's 2015 recommendations The Financial System We Need and the findings of the EU's 2016 High-Level Expert Group on Sustainable Finance, then refined with input from experts in the field.
Real-economy queries are consolidated versions of equivalent climate change queries: Real Economy Climate Regulations cover Carbon Tax, Emissions Trading, Energy & Resource Efficiency, and GHG Emission Regulation; Energy, Industry and Land Transitions cover Renewable Energy, Energy Transition & Zero Carbon Technologies, and Carbon Sinks.
| Type | Policy Category | Description |
|---|---|---|
| High-level | Reforming the Financial Sector | Position on the need to reform the financial sector in response to climate change |
| High-level | Climate Science Stance | Position on the needed response to climate change science |
| High-level | Need for Climate Regulation | Support for financial regulations to tackle climate change in general |
| Policy-level | Disclosures | Support for policies/regulation on this topic |
| Policy-level | Taxonomies | Support for policies/regulation on this topic |
| Policy-level | Financial Products and Ratings | Support for policies/regulation on this topic |
| Policy-level | Investor Duties | Support for policies/regulation on this topic |
| Policy-level | Prudential Regulation | Support for policies/regulation on this topic |
| Policy-level | Real Economy Climate Regulations | Support for policies/regulation on this topic |
| Policy-level | Energy, Industry and Land Transitions | Support for policies/regulation on this topic |
| Disclosure & Transparency | Direct Policy Engagement | Transparency on positions and activities to influence climate policy/legislations |
| Disclosure & Transparency | Indirect Policy Engagement | Transparency on industry assocaiation relationships and their policy engagement activities |